OMAINTEC
JOURNAL
(Journal of Scientific Review)
ISSN 3005-6195
1


![]()
![]()
![]()
![]()
![]()
![]()
![]()
Arab Council of Operations & Maintenance
ISSU# 01 – April 2020
OMAINTEC.org
A refereed scientific journal issued semi- Annual by the Arab Council of Operation and Maintenance.
OMAINTEC Journal
(Journal of Scientific Review)


![]()
![]()
![]()
![]()
![]()
![]()
![]()
About the magazine
Publisher
The Arab Council of Operation and Maintenance
Address & Contact Info
Registerd NGO in Switzerland – Lugano
Via delle scuole 13, 6900 Paradiso, Switzerland
Riyadh Liason Office:
PO Box 19419 Riyadh 11435, KSA
Tel: +966 11 460 8822
Fax: +966 11 4608282
Website: www.omaintec.org
Email: ejournal@omaintec.org
© Copy rights reserved for The Arab Council of Operation and Maintenance
It is not permitted to reproduce, publish or print the articles or data contained in the magazine by any means without
the prior approval of the Arab Council of Operation and Maintenance.
It is permitted only to download the PDF files for research purposes and postgraduate studies.
Prof. Mufid Samarai


Editorial Board Committee
Senior Advisor at Sharjah Research Academy & Member of the Board of
Trustees of the Arab Employment Council, UAE (Head of Editorial Committee)
Dr. Zohair Al-Sarraj
Chairman of International Maintenance
Association (IMA) & Vice Chairman of the Board of Trustees of the Arab Council of Operation and Maintenance, KSA
Dr. Adel Al Shayea
Associate Professor at King Saud University, KSA
Prof. Essam Sharaf
Member of the Board of Trustees of the Arab Council of Employment
Dr. Mohammed Al-Fouzan
Chairman of the Board of Trustees of the
Arab Council for Operation and Maintenance
Editorial Secretary
Prof. Emad Shublaq
Member of the Board of the Arab Institute of Operation and Maintenance
Dr. Alan Wilson
Founder and Chairman of the UK Computer Aided Maintenance Management Group,
founder member of IMA
James Kennedy
former Chairman of Council of Asset Management (Australia) & IMA Board Member.
Prof. Wasim Orfali
Dean of the Faculty of Engineering / University of Taiba / Saudi Arabia
Prof. Osama Awad Al-Karim
University of Pennsylvania / USA
Professor Adolfo Crespo Marquez
SUPSI University (Switzerland)
Mr. Khairy Al-Kubaisi
University of Taiba / Saudi Arabia
Language Review Committee
Eng. Basim Sayel Mahmoud, Secretary General – Arab Council of Operation & Maintenance
OMAINTEC Journal
(Journal of Scientific Review)
Dr. Alan Wilson
Dr. Zohair Al-Sarraj
OMAINTEC Journal
(Journal of Scientific Review)
OMAINTEC JOURNAL OBJECTIVES
The magazine aims to be a distinctive platform through:
- Creating common ground of discussion among researchers, academics and Arab specialists in the operation and maintenance, facilities management and asset management sectors.
- Encouraging research in the operation and maintenance, facilities management and asset management sectors, and proper management of properties. The magazine will conduct research, scientific reviews or technical studies on the following topics in these sectors:
Operations and Maintenace

Management
Transformation for Asset
![]()
Management
Maintenance Performance Indicators
Safety
![]()
Management Systems
KPI
Methodologies And definition
Asset
Management
![]()
Strategy
![]()
![]()
planning in
facilities & asset management
Total cost of ownership
![]()
Energy
Management
facilities
Management
Operations and Maintenace

![]()
Standards
Environment Management Systems
![]()
![]()
Health and

safety polices
This Paper will set out to highlight some of the Industry 4.0 pressing issues

OMAINTEC Journal
(Journal of Scientific Review)
The European Experience Regarding Industry 4.0-
The Impact of Emerging Technologies & the Resultant Challenges Facing the Maintenance Function
Peter willmott
Associate PartnerSapartners, UK
FOCUS
facing European Service Utilities and Manufacturing companies & hence the implications regarding their Maintenance Capability & Performance within those businesses.
1.0 Scene Setting
From a European perspective the Paper will explore major innovations in technology that are coming to maturity at the same time and at a relatively rapid pace. Examples of this technology include
The Internet of Things-The integration of software, sensors and electronic items with internet and machine –enabled data collection and transfer in real-time-This means that traditional supply chains can become more digitised and connected and transparent. Machine sensor technology has huge implications for Asset Management and hence those machine operator’s and maintainer’s skill sets.
Big Data & Advanced Analytics-with the IoT at the macro level comes a huge amount of data. The way in which manufacturing businesses read, analyse and act upon the data at the micro level –for example from product development to equipment design to build, test and install for production-is potentially very powerful for decision making effectiveness and reduced lead time to market.
Artificial & Virtual Intelligence, Robotics & Automation-Robots are already being used extensively in Manufacture and Distribution and their development and use in smart factories which will have a massive impact on the skill sets of those taking care of and maintaining those physical assets. For example, role of the operator will evolve to become more of a machine supervisory role where the operator will supervise an automated process consisting of automated machines being loaded / unloaded by robots / cobots and AGV’s. Likewise the maintainers will need to be trained to become a highly skilled technician in the art of robotic maintenance, embracing electronics, precision maintenance & PLC faultfinding. This is In addition to machine-to-machine communications, which are all part of a wave of converging technologies.
OMAINTEC Journal
(Journal of Scientific Review)
Simulations,3D Printing & Augmented Reality-These are already becoming commonplace today, so that complex goods and their component parts can be rapidly designed at remarkable speeds and at much lower cost. Products can be designed and that same design sent to multiple sites, via email, anywhere in the world for local manufacture. This same technology can then be integrated into the plant and equipment design to enable augmented reality equipment spares -and associated on the job employee skills training and development- more effectively than with paper or monitors .
- Interestingly there is also an environmental impact of 3D printing of parts. With the
- ongoing debate on the use of plastics and the damage to the environment, the 3D
- printing of machine parts, traditionally machined from solid blocks of plastic, could
- greatly reduce the amount of waste product ending up in landfill sites or worse.
A Personal Experience Story
Before exploring the impact of Industry 4.0 on the future impact of Asset Maintenance I would like to share with a story from my personal experience over 25 years ago.
Whilst heading up a TPM study tour to Japan in 1992, we visited a recognised world class manufacturer and exemplar Japan Institute of Plant Maintenance TPM award winning company. As we entered the plant on our tour bus we saw that the outside factory wall had been painted with a colourful montage of trees, bushes, flowers and plants with a message written in both Japanese and English which simply stated said…‘Welcome to our Park within a Factory’ (not you will note a ‘Factory within a Park’.) So we, dare I say, slightly skeptical ‘European bastions of Industry’ went on a tour of the factory. The visual impact was indeed memorable from three perspectives:-
There were dedicated rest areas in several parts of the plant that had natural wooden seating, natural grass, running water with mini waterfalls, flowers and yucca plants galore.
There were also large transparent ‘windows’ in the roof to enhance a feeling of space and light. Everyone appeared to be working harmoniously rather than fast.
The TPM Facilitator and a small group of Operators and Maintainers gave a short presentation feedback in the debriefing room after the factory tour which highlighted the following metrics of what TPM had helped to deliver to the business over a 6 year period.
|
Key Performance Indicator |
Start Point Reference |
6 Years Later |
|
Breakdowns per month |
250 |
5 |
|
Overall Equipment Effectiveness |
65% |
88% |
|
Productivity Index |
100 |
180 |
|
Return on Investment |
$1.00 |
$4.50 |
OMAINTEC Journal
(Journal of Scientific Review)
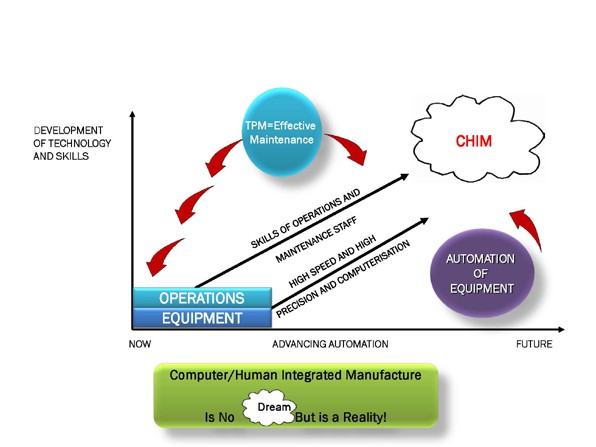
I vividly remember the Japanese Managing Director then walking up to a flip chart and progressively writing “…In the ‘1950s and ‘60s we had “M” for Manufacturing. Then, in the ‘70s we had “I M” for Integrated Manufacturing…. And then in the 1980s we had “C I M” for Computer Integrated Manufacturing. He paused for a moment and then said
“…For the remainder of this decade and 2000 and beyond, our company is going to be pursuing “C H I M”- Computer Human Integrated Manufacturing… .He added ’.. We have decided to re-introduce the human being back into our workplace !!” .
As the figure 1 below suggests- CHIM is no dream –it is a pressing reality. Today, over twenty five years later, my interpretation of that powerful message is that it certainly represents a challenge for all of us to develop and harness people’s skills in parallel with advancing automation, data capture and technological innovation in what is being referred to as the 4th Industrial Revolution or Industry 4.0 for short.
The bottom line is that it’s our people at the sharp end of the business that will continue to make the difference
figure 1-The Future Vision & impact of TPM on Operational Excellence
The biggest-and often false- assumption nowadays is that regular visible and physical ‘human’ inspections & maintenance are grossly undervalued and the technological tail is left wagging the dog
The tail is an important part of the dog- but in this analogy the dog is the human being.
In spite of embracing technology, there will always be some principles of work that will remain embedded within the philosophy of TPM. Of course we will need to be agile ,flexible and innovative in how we adapt to the challenges that The Internet of Things, Big Data & Advanced Analytics, Artificial & Virtual Intelligence, Robotics & Automation Simulations,3D Printing & Augmented Reality will bring and indeed is already doing so.
Against this back drop of reality and acceptance, we are also convinced that competitive manufacturing capability will come from those companies who focus on the judicious and innovative application of available automation and technology.
Already we are seeing that the fundamental and under-pinning people engagement practices, through teamwork, goal alignment and deployment, depends on a leadership style that is able to progressively trust to delegate. This factor will become even more important as technology becomes even more multifaceted.
However it is also my firm belief that maintenance in the sense of using spanners and screwdrivers will be here for some while yet !!
The Problem and hence Opportunity facing European Businesses
Understanding what Industry 4.0 can offer is a far cry from being able to take advantage of it.
OMAINTEC Journal
(Journal of Scientific Review)
A recent survey of over 400 UK based businesses carried out by the Institution of Engineering and Technology highlighted the following
52% are currently recruiting for new engineering and technology staff
57% are experiencing problems recruiting senior engineers with 5 to 10 years experience
68% are concerned that the education system will struggle to keep up with the skills required for technological change implied in Industry 4.0.
62% are specifically concerned about the availability of relevant graduate skills
59% feel the content of engineering and technology degrees do not suit the needs of their organization because they do not develop relevant practical skills nor do they have a background of prior work experience
91% agree however, that to improve the supply of engineers and technicians, more employers need to provide work experience for those in education or training
76% of employers like-wise agree that compelling all engineering and technology dependant companies to provide work experience would improve the pool of engineering talent.
68% of employers say they are concerned that the education system will struggle to keep up with the skills required for technological change –again implicit in Industry 4.0 – but only 51% report that they are takeing steps to influence the content of degrees and the technical training engineers undertake
These findings mirror closely a recent survey by McKinsey which found that 7 out of 10 companies have not formally defined their Science, Technology, Engineering and Mathematics (STEM) skills gaps and only 1 in 10 are implementing a plan aimed at bridging the skills gap impact.
I recently discussed the implications of this with a long standing colleague of mine Denis McCarthy (who was my co-tour guide on the CHIM visit back in 1992) and we shared our recent European experiences regarding all of the above research. We concluded that we need to be asking at least 5 pertinent questions in our individual European companies that depend on physical assets to deliver their customer’s requirements in full.
Q1-Is our Company keeping pace with the emerging Technologies?
The pace of technological progress is so rapid that traditional academic education cannot keep pace with developments in for example memory capacity, sensors and artificial intelligence. This is an area where in-house learning using practical hands-on ‘Learning by Doing’ projects is essential. Organisations that do this well will also focus on pockets of automation using multi-disciplined teams –including and especially frontline operators as well as the maintainers and engineers-plus of course their team leaders.
Experience shows that cultural change through proactive involvement of the equipment users and maintainers invariably exceeds initial expectations and overcomes the most daunting of ‘technology’ driven challenges.
It is also important to remember that simple to use, cost effective devices such as digital process indicators (DPI) can be added to existing physical assets to show changes in performance in for example
OMAINTEC Journal
(Journal of Scientific Review)
the variables of temperature, pressure and electrical current. The European experience shows that front- line operators with training and combined with routine cleaning and inspection checks pays big dividends acting as the early warning system for their maintenance colleagues to take preventive action and avoid catastrophic breakdowns. This approach is at the heart of the well proven TPM philosophy.
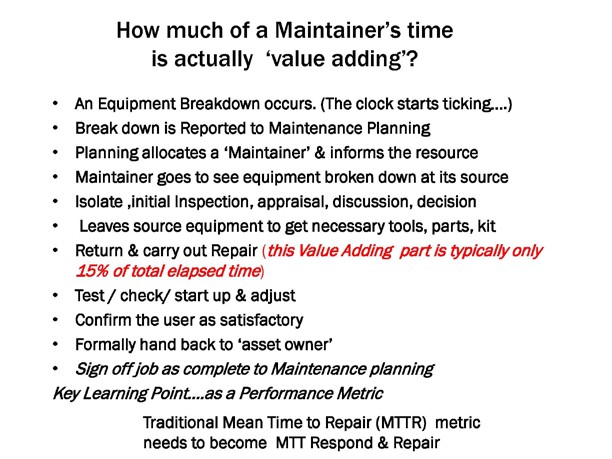
Q2-What percentage of time spent by your current staff is fully productive and hence ‘value adding’? and the second part to this Question…..How good or effective are your Systems of Work and supporting processes to systematically improve on your answer to the first part?
In one company where we diagnosed the effective use of a typical equipment maintainer’s use of time the event sequence and profile emerged as illustrated in the figure 2.0 below. This showed that when looking specifically at responding to equipment breakdowns we found that only 15% of time spent by the maintenance engineers was fully productive in the sense of ‘value adding’. In our experience, this is often the norm rather than the exception.
With the interactive nature of real time data collection within Industry 4.0 digitalization, this allows our CMMS systems to report each of the 11 sequential steps below. This fact then enables us to produce a Current State Map of what happens now and then use this information to ‘Brown Paper Map’ every element in the 11 steps as either an Operation, Movement, Delay, Storage, Inspection or Electronic Data entry.(the Operation elements are the only ‘Value adding’ activity. The other five elements are either non-value adding or they may be essential (for traceability purposes) but non-value adding.
We can then use the Current State Map to challenge each element by asking the ECRS question…Can we Eliminate this step? And if not, can we Combine it with another step up steam or downstream? Or Replace it with something smarter ? or at least Simplify it?. The result of this challenge process then becomes our Future State which is implemented as Standard Work once proven. It is our experience that if you get the right frontline people involved in this Brown Paper Mapping and Challenge process then the Total response and Repair times can be reduced by up to 50% of current practice by working Smarter (and not definitely not Harder!)
Figure 2.0 Equipment Breakdowns are only 15% value adding
Q3-How well does your organisation encourage a positive attitude to learning in the workplace?
Skilled personnel are not usually tempted to change jobs for just personal development opportunities and
/ or financial reasons alone. They tend to be motivated by in-house opportunities for self-development and job satisfaction. European Surveys show that training and development are key job satisfaction factors for nearly 70% of STEM workers. Food for thought if you want to keep the engineers you have!
Q4 . How well defined is the ideal engineering team skill profile, where are the gaps and how good is your company at developing the skills it needs?
This includes transferring lessons learned and helping engineers to acquire new capabilities. Organisations that do this well can reduce the time to achieve local site specific competency levels by as much as 75%.
It is important to reflect here on the European experience of Skills Capability Development over the last 40 years or so as illustrated in figure 3.0 below. This have been driven by enlightened attitudes from both Trade Unions and Management working in partnership rather than the adversarial confrontation of the singled skilled craftsman of the 1960’s and 1970’s .
OMAINTEC Journal
(Journal of Scientific Review)
During the 1980’s and 1990’s we saw the advent of Multi Skilled Craftsmen-especially (but not exclusively) between the Mechanical and Electrical trades.
Throughout the early 2000’s to the present day we have seen strong evidence in many European Manufacturing and Utility Companies of using Enabling Agreements to build flexible Team based working involving not only Maintenance Engineers but also and most importantly their Operator colleagues – Where it’s no longer appropriate for the Operator to say to his Maintainer colleague ‘I operate, you fix…I add value… you cost money..So watch out!!
On the contrary, these enlightened enterprises build a culture which delivers a mind-set that believes that effective team-working between the core operators and maintainers working in harmony is the best way to create maximum product flow through their physical assets.
The challenge now for these enlightened enterprises is to embrace the appropriate technologies that Industry 4.0 presents us with to build versatile, purposeful and innovative teams who are progressively encouraged and trusted by their Managers to become self managed teams within clear boundaries and rules that they have had a clear say in setting and will continuously improve.
It may come as a surprise to some that all four of the above areas are within the scope of Total Productive Maintenance (TPM) principles and techniques.
Often incorrectly characterized as simply operator maintenance, the TPM road map systematically removes the causes of reactive management to release engineer and management time to focus on higher value-added activities. Within the TPM process, education and training is used to ratchet up equipment effectiveness, by refining working methods and standards to prevent breakdowns and systematically remove the causes of common problems. Through this process, cross-functional front-line teams become engaged with learning through their involvement with task simplification.
Figure 3.0 The History and Developing Future Skills requirements
Such cross-functional team-based projects not only develop engineering skills, but also provide a vehicle to develop innovation, project management and leadership competence. The investment in time results in a bottom line return worth between six to eight times the cost. Perhaps the biggest benefit is the impact on the way skills are applied and future capabilities are developed.
There is no doubt that without skilled workers, it is hard for a business to grow, especially in the manufacturing and technology sectors. These are challenges that TPM and aligned tools like fast-track RCM are designed to overcome
What is fairly certain and predictable is that more new machines, processes and systems than ever before will be created. In which case they will need to be repaired and eventually replaced- in other words, maintained !!
This will create an opportunity for maintenance to be considered as a Value-Adding activity-rather than ‘A Necessary Burden’ as has been the case in the past.
For far too long the Maintenance function in many European Businesses has been regarded as a non- value adding direct cost burden-and hence a regular annual budgeting target for cost cutting-in the sense of doing the same with less people.
OMAINTEC Journal
(Journal of Scientific Review)
Fortunately, over recent times with the advent of Lean Thinking and now the emergence of Industry 4.0, together with the aspiration to achieve ‘Operational Excellence’ means that these enlightened Businesses view the Maintenance of their strategic physical assets as a value-adding system and process.
Operational Excellence is about striving to eliminate waste in all its forms in order to maximise value– adding activity. It is about the speed or velocity with which we can convert a customer’s order into money in our bank account. This is surely sound common-sense and as such we need to be excellent at it.
The resultant drive and focus on most of our Asset based Processes- whether Service Utility orientated or Manufacturing- is highlighting what we’ve probably always known:-namely that the concept of Operational Excellence is only as good as the Reliability and Predictability of our strategic physical Assets.
Low levels of Equipment Effectiveness often result in those critical physical Assets becoming the Pinch- Point in the Customer Service Supply Chain.
As a Maintenance Manager you will be under continuing pressure to cut the Direct Costs of the Maintenance Function NOW to be more efficient
As a Maintenance Professional you will still be striving to increase the Effectiveness of the Maintenance Delivery-The bottom line is that you will almost certainly need to do more with less… and, whichever way we look at it-that is the reality and therefore the challenge.
Our European experience suggests that In the Maintenance sense, this all has to be achieved in parallel with yet more pressure and demands on increasing environmental conformity, increasing energy costs and of course, zero accidents.
……And now, on top of all this we are having to cope with the 4th Industrial Revolution via Industry 4.0 !!!
At a Management level, delivery of Industry 4.0 will require individual Asset based businesses to think about and specify their particular new skills requirements. This will require strong and consistent management to support up-skilling of existing staff. It will also necessitate the training of their staff to be able to deliver both the transition and then subsequently the maintenance of those new technologies
In parallel those same Manufacturers and Utility Service Providers and their Outsourcing Partners will need to proactively collaborate with our universities and centres of further education to deliver the necessary Science, Technology, Engineering, and Math (STEM) Skills for their future talent pipeline
At the sharp end of the business, every Maintainer will need to be a knowledge worker in the sense of knowledge -knowing what it is.
skills -knowing what to do with it.
experiences -know when things go wrong and why
and capability-know how to fix it and- most importantly- how to prevent reoccurrence of that same issue.
- What might be the future impact of Operational Excellence (OE) be on these technologies in the transformation of those Service Utilities and manufacturers as we know it today?
It is more likely that organisations with a sufficiently high level of Operational Excellence ‘maturity’ under their belt, will gain more benefit, sooner from this next stage of business evolution than their competitors who lag behind the OE ‘maturity’ curve.
OMAINTEC Journal
(Journal of Scientific Review)
As OE practitioners already know, this level of excellence can only be attained through an incremental, maturity-based approach to operational excellence as well as the fundamental and parallel people engagement practices.
Culture will once again continue to ‘eat strategy for breakfast’ in this battle for survival !!
- Technology will no doubt simplify things, but is there a danger that the technological tail will wag the dog ?
Technology will undoubtedly simplify things, but will also create a level of abstraction that can be wasteful or even dangerous.
Consider the modern day Control Room-We have all these highly qualified control room operators spinning around on swivel chairs watching all these mimic screens with green and occasional red lights flashing on and off –who have been lulled into a false sense of security-whilst out there in the real world of the physical asset with that critical prime-mover, such as a pump or motor- is going drip, drip, hiss and eventually bang ! Likewise, both product, & energy could be ‘flushing down the drain’ due to faulty valves or devices, creating huge wastage and costs
Maybe we need to rediscover some of our old values and behaviours and start walking the talk !
The biggest-and often false- assumption nowadays is that regular visible and physical ‘human’ inspections & maintenance are grossly undervalued and the technological tail is left wagging the dog.-The tail is an important part of the dog- but in this analogy the dog is the human being.
As such, maintenance in the sense of using spanners and screwdrivers will be here for some while yet !!
- Concluding Remarks
This paper has set out to share with you that Competitive Asset Management capability will come from those companies who focus on the judicious and innovative application of available automation and technology available within Industry 4.0. Already in Europe we are seeing that the fundamental and under-pinning people engagement practices, through teamwork, goal alignment and deployment, which depends on a leadership style that is able to progressively trust to delegate. This factor will become even more important as technology becomes even more multifaceted. The Middle East business enterprises may well need to carefully adapt to this enlightened form of Partnership approach especially between the Asset Owner and their Maintenance Service providers
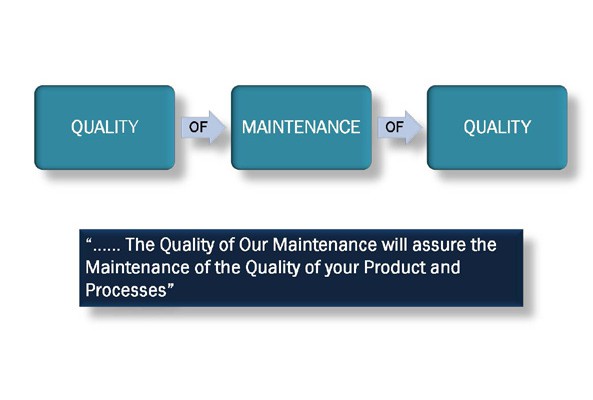
The figures 4.0 below illustrates the vital importance that Maintenance plays in delivering the core Quality of your Business purpose, product and processes
Figure 4.0 Asset Maintenance and Product Quality are tied partners
Finally, as figure 5.0 illustrates, it is my firm belief that the careful and judicious use of Industry 4.0 technologies will enable your Plant to be a World Class Facility-where your people will make the difference and NOT just technology alone. Also remember that maintenance in the sense of using spanners and screwdrivers will be here for some while yet !!
OMAINTEC Journal
(Journal of Scientific Review)
Figure 5 Delivering the Vision through Industry 4.0
Figure 1
OMAINTEC Journal
(Journal of Scientific Review)
Figure 2
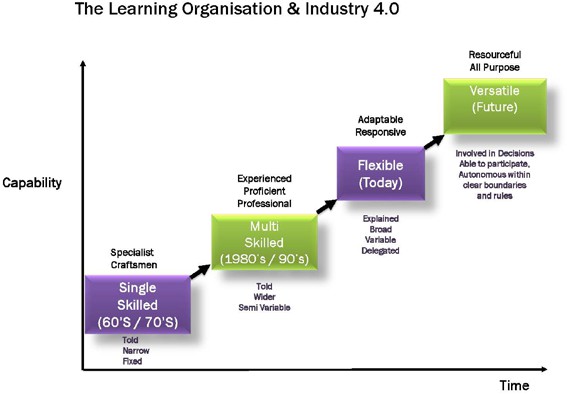
Figure 3
OMAINTEC Journal
(Journal of Scientific Review)
Figure 4
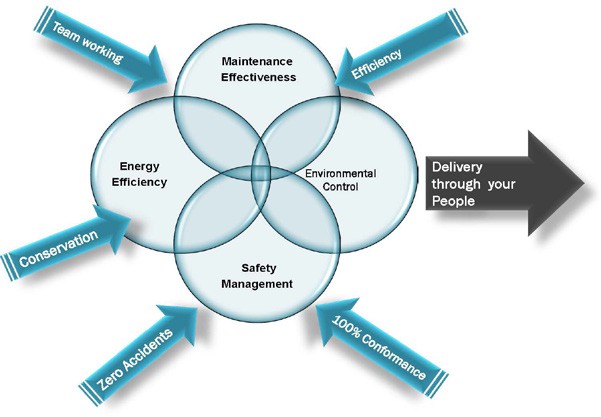 Figure 5
OMAINTEC Journal

(Journal of Scientific Review)
Machine learning in Maintenance Optimization: Opportunities and Challenges
Chi-Guhn Lee
Director, Centre for Maintenance Optimization and Reliability Engineering (C-MORE) Dept of Mechanical and Industrial Engineering, University of Toronto, Canada
Under predictive maintenance scheme, an estimate of the health status of a piece of equipment is carefully computed, and used as the basis of preventive maintenance action before an actual failure. Pre-failure intervention actions are carefully chosen among options such as corrective action, replacement and even planned failure based on health factors [8]. With the advent of Big data and computing technology, the predictive maintenance is in the midst of rapid transformation to take advantage of the recent technological advancement, namely machine learning.
Machine learning methods use statistical techniques to enable algorithms to iteratively improve without explicit programming of models and functions [7]. This flexibility enables exploration into areas with less robust hypotheses where the expected outcome is unknown. Machine learning is a quickly growing area of research.
There are three kinds of machine learning methods depending on the availability of data and the nature of output the method is supposed to make. A majority of practical machine learning can be classified as supervised learning. In supervised learning, the algorithm uses data in which the desired output value is known. For example, in a population of generator histories including information on various characteristics of the generator, the variable of interest may be if and when the generator failed. This information would be available as known values in the data, and falls under supervised learning methods. The second type of machine learning is unsupervised learning, in which the desired output value is not known. Unsupervised learning can be quite powerful in that they operate beyond our preconceptions. For example, a fleet of generators may be grouped into categories where the specific characteristics of each group are unknown. The last major type of machine learning is reinforcement learning. In reinforcement learning, an agent performs a particular goal by interacting with the environment that provides feedback. Using this type of algorithms, the agent (or machine) is trained to make specific decisions [7].
In this paper, some enduring algorithms that have been used in many different contexts will be discussed, and applied to a case involving multiple power generating units.
Machine Learning Methods
There are three kinds of machine learning methods depending on the availability of data and the nature of output the method is supposed to make: supervised learning, unsupervised learning and reinforcement learning [8, 10]. In this section we will review the three types in more detail.
OMAINTEC Journal
(Journal of Scientific Review)
Supervised learning methods
Within supervised learning, the two main categories are regression methods and classification methods. Regression methods model the relationship between equipment characteristics (i.e. features) and the output variable. Classification methods separate units into different classes, where the classes are known. A classic example of a classification method would be spam filters in email systems [1].
Linear regression
Linear regression was developed in the field of statistics and is studied as a model for understanding the relationship between input and output variables, but has been borrowed by machine learning. The output values can be calculated from a linear combination of the input variables. When there are multiple input variables, literature from statistics often refers to the method as multiple linear regression [1]
Logistic regression
Logistic Regression is one of the most commonly used machine learning algorithms for classification. Similar with linear regression, it is also borrowed from the field of statistics and despite its name, it is not an algorithm for regression problems, where you want to predict a continuous outcome. Logistic regression measures the relationship between the dependent variable (label and what to predict) and the independent variables (features), by estimating probabilities using its underlying logistic function. These probabilities must then be transformed into binary values in order to actually make a prediction for classification [2]
Neural networks
An artificial neural network (ANN) is a computational model that is inspired by the way biological neural networks in the human brain process information. The basic unit of computation in a neural network is a neuron. A neural network consists of at least three layers that are made of multiple neurons. The first layer is called the input layer where the input information is split and fed into each neuron. These neurons generate information for next layer based on weight functions, which is assigned on the basis of its relative importance to other inputs. The final layer is called the output layer. Using this method, algorithms are able to find patterns in datasets and even learn from its mistakes, which allows artificial intelligence to iterate itself and improve its predictions [3, 4]
Unsupervised learning methods
Unsupervised learning algorithms operate in situations where feature data are given without desired outputs, and therefore the machine learning algorithms should figure out how to draw conclusions only from the given features. As a result, results of unsupervised learning must be interpreted with caution.
OMAINTEC Journal
(Journal of Scientific Review)
K-Means clustering
In K-Means clustering, observations are given in the form of vector, and the clustering of vectors is based on relative distance among the vectors. Vectors belonging to the same cluster will has smaller distance to the centroid of the cluster than that of other clusters. K-Means clustering algorithm is simple to understand, apply and provides less biased results. However, the number of final groups needs to be set ahead by users. Besides, the algorithm is computationally expensive [9].
Affinity propagation
Unlike K-Means clustering, affinity propagation doesn’t require number of groups determined before running the algorithm. It is based on the concept of ‘message passing’ among observations. Similar to K-Means clustering, observations in the final groups will be representative. It is most suitable when we don’t know how many groups the observations should be assigned in [3]
Hierarchical clustering
Hierarchical clustering seeks to build a model of hierarchical clusters compared to K-Means clustering and affinity propagation. Observations are clustered in more than one group. There are two common strategies we usually use. One is usually referred as ‘Agglomerative’ or ‘Bottom Up’ approach, in which each observation is first treated as one cluster and then some of them may merge into one. The other is called ‘Divisive’ or ‘Top Down’ approach, in which all observations are in the same group and separations are performed recursively [9]
Case studies
In this section we apply some of the machine learning algorithms to a case, where we analyze maintenance records from 480 hydro generating units at a hydro power plant in Niagara Falls, Canada. The units failed for various causes from 114 components. While the data set involves over 0.6 million entries, it lacks the richness in features, making some machine learning approaches infeasible. We will present difficulties we experienced, leading to recommendations in the paper.
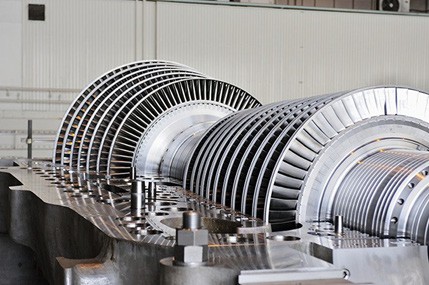
Figure 1 472-megawatt steam turbine generator (photo credit: businesswire.com)
Estimation of the classification error
OMAINTEC Journal
(Journal of Scientific Review)
3.1 Data Requirements
When using a machine-learning approach to predictive maintenance, the data requirements are somewhat different from analytical methods. With machine-learning approaches, the requirements can be more flexible, in that specific values for every entry may not be required due to a pooling effect, but that very large data sets are necessary in order to take advantage of machine-learning algorithms [5, 6, 10].
The design of a pattern recognition system consists of several stages:
Data collection
Formation of the pattern classes Feature selection
Specification of the classification algorithm
Of these stages, the first three steps are directly related to the data preparation. This section discusses some strategies and best-practices to inform the data collection, formation of pattern classes and feature selection.
The amount of data required is predicated on the complexity of the problem as well as the algorithm being used. If the relationship between the input and output variables is simple and evident, less data is required. However, the underlying function that relates the input variables to the output variable may be complex. The more complex the relationship, the more data is required. Similarly, the learning algorithm being used to inductively learn the relationship may be complex and have a higher data requirement. Conversely, the quantity and quality of the data on hand may afford some analyses and algorithms better than others.
The metrics for quantity and quality of the data are based the nature of the characteristics of the data. The analytical parallel would be condition monitoring data. In machine learning, these characteristics of information are called features. High-quantity data will have many features, that can serve as input variables, and many entries, that serve as values of the input variables. However, the features may not amount to much information if they are all highly correlated. For example, consider a column of state codes; a second column that describes those very state codes in words does not add any information to the model that the numeric state codes cannot. This leads us to high-quality data. Quality can be measured by the independency of the input features.
One of the unique issues with maintenance applications of machine learning is that the data size tends to be smaller than typical machine learning applications due to relatively rare failure events. When faced with a small sample size, some strategies for selecting design parameters include
careful selection of features and subsets used in decision making number of neighbors in a k-NN decision, and
width of the Parzen window in density estimation.
If the resulting classifier has a large error rate, this can usually be attributed to the inherent difficulty of the classification problem.
OMAINTEC Journal
(Journal of Scientific Review)
3.2 Clustering generating units
The algorithm we applied is K-Means clustering. It has more options to control and expect the output results, compared to other clustering algorithms, such as affinity propagation. There are couples of parameters, which are number of final clusters, number of times the algorithm will run on sets of random starting points and number of iterations on each set of starting points, are generally most important. These parameters are vital to generate stable results from the algorithm.
The power system we are working on in this paper is hydroelectric power system, which utilize the water resource to generate electricity. The theory behind is to construct a dam on the river with a large drop on elevation. The reservoir stores a large amount of water. When the water intake is opened, gravity causes the water to fall. The moving water turn the turbine propeller and generate electricity.
The number of clusters we set is three. The most important reason we chose this algorithm is this algorithm is easy to apply but can provide unbiased results. We have three clusters produced by the algorithm at the end. We would like to label them as ‘cluster 0’, ‘cluster 1’ and ‘cluster 2’, with 50, 66 and 312 of different units inside respectively. The following table shows part of the summarized information of each cluster:
Table 1 Summary of three clusters identified
|
Cluster 1 |
Cluster 2 |
Cluster 0 |
|
|
Average number of Forced outages |
25.985 |
13.603 |
17.460 |
|
Average number of Maintenance outages |
30.758 |
15.026 |
23.400 |
|
Average number of Planned outages |
15.833 |
10.250 |
26.100 |
|
Average number of Common modes |
0.015 |
1.263 |
0.280 |
|
Average maximum capability |
46.533 |
58.185 |
306.586 |
|
Average working hours |
37738.700 |
38917.044 |
35084.975 |
By inspecting the summarized data, we can draw preliminary conclusions about the characteristics of units in each cluster. We can utilize these conclusions to determine if our results make sense. We will also like to demonstrate some procedures about how this primary inspection is done. We hope to provide some basic ideas, which can be adopted and used in other applications.
Cluster 0 has its average maximum capability of the units much larger than the other two clusters. One reasonable assumption we can make here is that, cluster 0 seems to contain most of the important units because of the highest maximum generating capability. The higher the maximum capability is, the less we want the units to forced outage.
In order to prevent failures, highest planned outages number is scheduled on these units, even these units have the lowest average working hours. This explains why the average number of planned outages in cluster 0 is the largest. Because of the excessive attention payed in cluster 0, even with the largest generating power, units in cluster 0 have smaller number of forced and maintenanced outage, compared to cluster 1. In conclusion, units in cluster 0 are mostly important to the company and the maintenance performed is effective.
OMAINTEC Journal
(Journal of Scientific Review)
Cluster 1 contains the units that we think that are most problematic. One of the reasons is that, even with relatively large number of planned outages, units in cluster 1 still have the highest average number of forced or maintenance outages, which implies these units are most easily to fail compared to others. These units also have the smallest average maximum capability, which should have failed the least. Units also have the smallest average number of common modes, which tells us outages on these units are highly unlikely to be caused due to other generating units.
Cluster 2 contains the units that are most reliable. Given the medium number of maximum capability and maximum working hours, units in cluster 2 have the least number of forced, maintenance and planned outage. These units also contain the largest number of common modes, which shows that a lot of the outages on these units are caused by others.
By applying the similar analysis, interesting conclusions can be drawn on different applications, leading to further investigation of the outage components. In our case, we can simply treat each outage component as a random variable and investigate their correlation coefficient factor among. The following picture shows the correlation coefficient among the components.
One of the most important steps before applying the machine learning algorithms is to convert the raw data into useable data. The main purpose is to remove the errors and conduct feature engineering to prepare the final data for algorithms. To remove the errors, what we have done includes but not limited to:
Remove redundancy: redundant information is one of the most common errors in all kind of data. For example, there may be some records that are exactly the same and they should be removed.
Remove units with inadequate amount of records: in our case, units with records less than two years or with recorded number less than 100 will be removed.
Remove or recover missing values: ideally, the best solution here is to apply different techniques to recover the missing or inconsistent values. However, if the amount of missing values within one observation is too large, the assumptions we make may strongly affect the recovered values. In this case, we will prefer remove the observations instead.
Remove or recover inconsistent values: similar to missing values, we should consider recover the inconsistent data using other given information. If the recovery may strongly affect the results, we will remove the observations instead.
After errors have been eliminated, a step called ‘feature engineering’ is conducted. The steps we would like to emphasize are elaborated here:
Dimensional reduction: in this step, we will remove some information that is highly correlated to others. For example, features with high correlation coefficient maybe be selected to remove.
Extract useful and generate new information: for example, in our raw data set, it has the records of each generating unit with its current operating conditions in different time duration. For each generating unit, we can calculate the total number of forced outage occurs in his whole life.
OMAINTEC Journal
(Journal of Scientific Review)
As a result, the information contained in the final data set includes the number of times forced outage, maintenance outage, planned outage and outage component occur for each generating unit. It contains the number of times each generating unit has failed due to other units, maximum capability and the total effective working hours of each generating unit.
Challenges and Opportunities
Throughout the whole process of application, there are some limitations and errors which we believe can strongly affect the results. In order to provide a more thorough understanding of the technique we applied, we would like to address couples of points that we believe are vital to the success of this application. Besides, most of the following limitations appear quite frequently in other applications. We hope these can be used as inspirations for other different applications
Limitations we considered during the process:
We assumed units are identical in all aspects: in our raw data, we did not have sufficient detailed information about the generating units, such as the type, date to operate or which companies the units from. There are a lot of factors that may affect the final results. For example, there could be chances that some type of generating units are much easier to fail compare to other types.
We assume the missing values should be discarded: as what we have addressed above, it would be the best to recover the missing values. However, due to the limited information and understandings of our data, we believed it would be the best to get rid of them instead. Because the more biased the final data is, the higher the chance our results will be not representative in general.
Insufficient records of some units: after preprocessing out raw data, we realized that a lot of units have number of records less than 100. Among all 480 different units, the average number of records is 1246.51. The maximum number of records is as large as 17417. The level of detail our data provides can impact the results strongly.
A lot of outliers when we look deep into the final results: for example, when we checked the forced outages number for the units in cluster 2, there are five units, which are HGU 0012, 0517, 0591, 0711 and 0841, that have much large forced outages number compared to the rest of units within. Some of the outliers can be considered as acceptable units after comparing the other numbers, such as HGU 591, 0711 and 0841. The rest two units, HGU 0012 and 0517, may worth a further investigation.
Given the limitations we have found during the process, we believe the following recommendations will help for future applications and more accurate results.
Recommendations:
Working with domain experts: with the help of domain experts, we can be able to get a deeper insight to the data. Experts can help us to validate our assumptions on the units, which can produce a more concise, accurate and effective input data.
OMAINTEC Journal
(Journal of Scientific Review)
Non-maintenance-related data can be useful: among the features we can obtain from our raw data, all of them are related to maintenance, such as outage number of working hours. Other information, such as indoor or outdoor the units are, may largely improve the results.
Outliers can be further investigated: outliers can as well potentially help us to find out the hidden relationship among the units and their outage components. They may also bring different aspects for us to look at our system. For example, unit HGU0012 we mentioned above have large number of total common modes as well. One of the potential direction we can conduct a further examination is to figure out what units or components that cause most of its forced outages. These units or components may worth more attention to be paid in the future.
Unsupervised results can be utilized to train supervised algorithms for future predictions: if we are satisfied with the results and analysis from the clustering algorithms, the labels can be further used for different supervised algorithms, such as linear regression or neural network. Given an unseen unit, when these supervised algorithms are well trained, they can be used for multiple purposes, such as predicting whether the new units are reliable in the future.
Most of the limitations and recommendations can be generalized in different cases.
Conclusions
We have survey some of the most common machine learning algorithms, and share our experiences with the application of the algorithms with a case study. In particular, we have found that seemingly big data in the maintenance optimization applications turned out to be in fact small due to inconsistency and redundancy. Also, the data is heavily skewed as failure, thankfully, is usually very rare, making supervised learning challenging. This is why we present in this paper results of clustering, which is an unsupervised learning algorithm. Despite the challenges, machine learning has a big potential in maintenance optimization and reliability engineering, and we hope that the case study presented in this paper would set a direction for future attempts of using machine learning for more effective and efficient maintenance, repair and operations.
References
- J. Brownlee, “Linear Regression for Machine Learning,” Machine Learning Mastery, 25-Mar-2016. [Online]. Available: https://machinelearningmastery.com/linear-regression-for-machine-learning/. [Accessed: 20-Aug- 2018]
- N. Donges, “The Logistic Regression Algorithm – Towards Data Science,” Towards Data Science, 05-May- 2018. [Online]. Available: https://towardsdatascience.com/the-logistic-regression-algorithm-75fe48e21cfa. [Accessed: 20-Aug-2018]
- B. J. Frey and D. Dueck, “Clustering by Passing Messages Between Data Points,” Science, vol. 315, no. 5814, pp. 972–976, 2007 [Online]. Available: http://dx.doi.org/10.1126/science.1136800
- I. Goodfellow and Y. Bengio, “Deep Learning”, MIT Press, 2016
- Y. Jiang, J. D. McCalley and T. Van Voorhis, “Risk-based resource optimization for transmission system maintenance,” IEEE Transactions on Power Systems, vol. 21, no. 3, pp. 1191-1200, 2006
- H. Kim and a. C. Singh, “Reliability modeling and simulation in power systems with aging characteristics,” IEEE Transactions on Power Systems, vol. 25, no. 1, pp. 21-28, 2010.
- K. Murphy and F. Back, “Machine Leaerning: A Probabilistic Perspective,”
- C. Nyce, “Predictive analytics white paper,” American institute for chartered property casualty underwriters, Malvern, 2007.
- L. Rokach and O. Maimon, “Clustering Methods,” in Data Mining and Knowledge Discovery Handbook, pp. 321–
352 [Online]. Available: http://dx.doi.org/10.1007/0-387-25465-x_15
- J. Zheng and A. Dagnino, “An initial study of predictive machine learning analytics on large volumes of historical data for power system applications,” in IEEE International Conference on Big Data, 2014.
OMAINTEC Journal

(Journal of Scientific Review)
AIRPORTS AND HIGHWAYS PAVEMENT PERFORMANCE EVALUATION FOR MAINTENANCE NEED- CASE STUDY
Ibrahim M. Asi*, Aya I. Al-Asi
Regional Center of Excellence for Pavement Studies & Evaluation Manager Arab Center for Engineering Studies (ACES) – Amman, Jordan
Teacher at Civil Engineering Department.. Applied Science University – Amman, Jordan
In this paper there are details about the four pavement performance evaluation characteristics, their meaning, measuring techniques, specification limits and required maintenance and rehabilitation techniques for each.
To illustrate methods of measuring the four characteristics and reporting the results a case study is presented about a recently performed pavement evaluation project for Dubai International Airport.
Pavement Performance Evaluation
Transportation is a catalyst for development of any society. Road transportation is considered as veins and arteries of a nation, thus roads are constructed with variety of materials & specifications to mitigate the connectivity problems. Therefore, highest care is always taken in designing & developing the road networks. This is usually done by designing the network of roads or designing components of roads or in considering materials for construction [1]. Hence, it is very essential to analyze pavements for their responses on application of vehicular loads. Due to repeated application of loads, the performance of the pavement deteriorates and hence damage assessment procedures are required to be carried out to rectify the defects produced in the pavements to provide the required performance by conducting tests and surveys like structural surveys, distress surveys, texture depth & skid resistance surveys and pavement surface roughness surveys.
The ability of a pavement to withstand traffic and airplanes loads in a safe, comfortable and efficient manner is adversely affected by the different types of the pavement distresses. Therefore, monitoring the performance of pavement will help to determine the current condition of the pavements and, consequently, a management plan for maintenance, rehabilitation, or reconstruction [2, 3].
Four characteristics of pavement condition are usually objectively measured to evaluate pavement performance and need for rehabilitation. These measurable characteristics are:
Structural evaluation – pavement deflection, cores and test pits; Functional evaluation -pavement roughness (rideability); Surface condition evaluation – pavement distresses; and
Safety evaluation – skid resistance.
OMAINTEC Journal
(Journal of Scientific Review)
Structural evaluation
Pavement structural evaluation is concerned with the structural capacity of the pavement as measured by deflection, layer thickness, and material properties. It is used to obtain information on the load-bearing capacity for both roads and airports to evaluate the need for maintenance and rehabilitation, asset pavement evaluation, and construction quality control.
Non-destructive testing has become an integral part of pavement structural evaluation and rehabilitation strategies in recent years. The falling weight deflectometer (FWD) is considered the most popular equipment used for non-destructive testing of airports and highways. FWD applies a load to the pavement and deflections are measured directly under the load and at set distances from the load. These recorded deflections are processed by back analysis software to estimate the modulus of each pavement layer and required overlay depth for the future design traffic. In small projects, the Benkelman beam can be used to assess structural adequacy of the pavement layers.
At project levels, destructive evaluation of the pavement can be used to evaluate its structural adequacy. Destructive evalauation includes extraction of cores, excavation of test pits, bore holes and trenches, etc.
Functional evaluation
Functional evaluation of pavements is primarily concerned with the ride quality or surface texture of a pavement section. Everyone who drives or rides in a vehicle over the surface of a highway pavement or inside an airplane over an airport pavement can subjectively judge the smoothness of the ride. Pavement roughness is defined as an expression of irregularities in the longitudinal profile of its surface that adversely affects the ride quality of a vehicle or an airplane, thus causing discomfort to the user. These irregularities lead to uncomfortable feeling for pavement users [4].
Smoother pavements are required because they provide comfort and safety to pavement users, reduce vehicle/airplane operating cost by reducing fuel and oil consumption, tire wear, maintenance cost and vehicle depreciation, and reduce pavement maintenance cost. Smooth pavements result in less dynamic loading from heavy trucks/airplanes loading, which reduces pavement distresses thus resulting in less maintenance and lower life cycle cost. Therefore, it is expected that smoother pavements will last longer [5].
There are two main methods for measuring road smoothness. These are subjective ride quality surveys (serviceability surveys); and objective roughness surveys.
Profiling devices, which are objective roughness survey systems, are used to provide accurate, scaled, and complete reproductions of the pavement profile. Among the most advanced profiling devices are laser profilers, which use non-contact laser sensors to measure differences in the pavement surface. To eliminate vehicle body motion and compute road longitudinal profile, accelerometers are placed on the measuring vehicle body to measure its vertical motion.
The International Roughness Index (IRI) is a scale for roughness based on the simulated response of a generic motor vehicle to the roughness in a single wheel path of the pavement surface. IRI is an index for roughness measurement obtained by road meters installed on vehicles or trailers. IRI true value is
OMAINTEC Journal
(Journal of Scientific Review)
determined by obtaining a suitably accurate measurement of the profile of the pavement, processing it through an algorithm that simulates the way a reference vehicle would respond to the roughness inputs, and accumulating the suspension travel. It is normally reported in inches/mile or meters/kilometer.
In South Carolina, IRI values are derived from wheel path profiles obtained using non-contacting inertial profilers. Typically, IRI data readings are taken at 0.16 km (0.10 mile) intervals and then are averaged [6]. IRI values less than 2.68 m/km (170 inch/mile) are considered acceptable and any IRI value less than 1.50 m/ km (95 inch/mile) indicates good roughness condition of the pavement [7]. For newly constructed or re- surfaced pavements in UAE, the acceptable ride quality of each completed lane of asphalt wearing surface for roads with speed limits greater than or equal to 100kph shall be less than 0.90 m/km. When any 100m section of completed road lane exceeds the specified IRI value of 0.90, it shall be considered deficient and unacceptable, it shall be rectified by removal, and replacement to meet the specified IRI limits [8].
Another parameter which is usually used to judge pavement roughness is Rolling Straight Edge (RSE) value, which is performed using rolling straightedge evaluation for the profiles collected using inertial profilers. It determines the vertical deviation between the center of the straightedge and the profile for every increment in the profile data.
Specifically for airports’ pavements, Boeing Bump Index (BBI) analysis is used to qualify pavements in the airports. The basis of the Boeing Bump analysis method is to construct a virtual straightedge between two points on the longitudinal elevation profile of a runway/taxiway and measure the deviation from the straightedge to the pavement surface. The procedure reports “bump height” as a maximum deviation (positive or negative) from the straightedge to the pavement. Bump length is the shortest distance from either end of the straightedge to the location where the bump event is measured. The procedure plots bump height and bump length against the acceptance criteria [9].
Boeing Bump Index (BBI) is determined by computing the bump height and bump length for all straightedge lengths for all sample points in the profile. For each straightedge length, the limit of acceptable bump height is computed for the computed bump length. For each straightedge length, the ratio (measured bump height) / (limit of acceptable bump height) is calculated. The BBI for the selected sample point is the largest computed ratio (Index) for all computed straight edges for the selected sample point. If the computed Boeing Bump Index value is less than 1.0 roughness falls in the acceptable zone, if it is greater than 1.0, it falls in the excessive or unacceptable zone [9].
Surface condition evaluation
Pavement condition refers to the condition of the pavement surface in terms of its general appearance. A perfect pavement is leveled and has a continuous and unbroken surface, while a distressed pavement may be fractured, distorted, or disintegrated. In order to obtain a useful condition assessment of the pavements, unbiased and repeatable survey procedures must be used. To provide for maximum usefulness, the survey procedures must be easily understood and relatively simple to perform in the field.
The most common survey technique used in the US and World Wide is the Pavement Condition Index (PCI) procedure developed by the US Army Corps of Engineers. The condition of the pavements is determined by a field survey of the surface operational condition of all pavements using this procedure. The PCI –
OMAINTEC Journal
(Journal of Scientific Review)
a measure of the pavement’s surface operational condition and ride quality on a scale of zero to 100, with 100 being excellent – has several unique qualities, which make it a useful visual surveying tool. It agrees closely with the collective judgment of experienced pavement engineers and has a high degree of repeatability [10, 11].
Patted, Vinodkumar, Shivaputra and Poornima [1] in their research developed a maintenance criterion for all the road stretches they have evaluated based on the pavement condition index values.
Kutkhuda [12] conducted a comprehensive study for the Municipality of Greater Amman in Jordan, which was financed by the World Bank. In the study, a pavement management system (PMS) was developed and implemented for Greater Amman. The PMS included a diagnostic stage, which consisted of assessment and evaluation of the existing pavement condition.
The PCI method was standardized and was included in ASTM Standards. The three ASTM Standard Procedures are:
ASTM D5340-12 “Standard Test Method for Airport Pavement Condition Index Surveys”.
ASTM D6433-18 “Standard Test Methods for Roads and Parking Lots Pavement Condition Index Surveys”.
ASTM E2840 − 11 (2015) “Standard Test Methods for Pavement Condition Index Surveys for Interlocking Concrete Roads and Parking Lots”.
The PCI has several unique qualities which make it a useful visual surveying tool; it agrees closely with the collective judgment of experienced pavement engineers and has a high degree of repeatability. It provides a standardized and objective method for rating the structural integrity and operational surface condition of pavement section. Furthermore, it is used for determining M&R needs and priorities by comparing the condition of different pavement sections, and for determining pavement performance from accumulated data.
PCI is a numerical index based on a scale from 0 to 100 with a value of 100 being a pavement in excellent condition, whereas a value of 0 represent an impassible pavement. The PCI is determined based on quantity, severity level and type of distress. The PCI has been divided into seven condition rating categories ranging from “excellent” to “failed”. These categories are useful for developing maintenance policies and guidelines.
Prior to conducting the PCI survey, a preliminary field survey is usually carried out to divide the total length of the pavements into sections of similar certain consistent characteristics and conditions. These characteristics include pavement structure, traffic, construction history, pavement rank, drainage facilities, shoulders, and condition.
OMAINTEC Journal
(Journal of Scientific Review)
These sections are then decomposed into smaller inspection units called “sample units”. A sample unit is defined as any easily identified, convenient area of a pavement section which is designed only for the purpose of pavement inspection. A sample unit is a conveniently defined portion of a pavement section designated only for the purpose of pavement inspection. For asphalt surfaced roads, a sample unit is defined as an area 230 ± 90 sq. m. While for asphalt surfaced airfields, each sample unit area is defined as 460 ± 180 sq. m. While for concrete roads and airfields with joints spaced less than or equal to 7.6m, the recommended sample unit size is 20 ± 8 slabs. For slabs with joints spaced greater than 7.6m, imaginary joints less than or equal to 7.6m apart and in perfect condition, should be assumed.
Deduct values associated with each distress type, severity and quantity combination are then determined and used to compute the final PCI value for each inspection unit. Depending on the final PCI value a pavement condition rating which is a verbal description of pavement condition is specified for each inspection unit and is also specified for the pavement section as a whole [10].
Safety evaluation
Worldwide, more than 1 million person is killed yearly due to traffic accidents. Although high percentage of these accidents is due to drivers errors, but highways have a significant effect on this high percentage of traffic accidents. The most important factor in the highways affecting traffic accident rates is the skid resistance. Accident rates increase in the rainy season especially after the initial rain showers. One of the main reasons for this increase is attributed to the low skid resistance of the highway surfaces. In addition, a number of the drivers do not give much attention to the depth of the grooves in their tires treads, and their driving habits do not change much during the rain period [13].
Surface friction or skid resistance is considered a safety characteristic of the pavement surface layers. Skid resistance is a measure of the resistance of pavement surface to sliding or skidding of the vehicle. It is a relationship between the vertical force and the horizontal force developed as a tire slides along the pavement surface. Therefore, the texture of the pavement surface and its ability to resist the polishing effect of traffic is of prime importance in providing skidding resistance.
- Skid resistance is an important pavement evaluation parameter because:
- Inadequate skid resistance will lead to higher incidences of skid related accidents.
- Most agencies have an obligation to provide users with a roadway that is ‘‘reasonably’’ safe.
- Skid resistance measurements can be used to evaluate various types of materials and construction practices.
Skid resistance depends on a pavement surface’s microtexture and macrotexture [14]. Microtexture refers to the small-scale texture of the pavement aggregate component (which controls contact between the tire rubber and the pavement surface); therefore, it is produced from the coarse aggregate. Macrotexture refers to the large-scale texture of the pavement as a whole due to the aggregate particle arrangement (which controls the escape of water under the tire and hence the loss of skid resistance at high speeds) [15]. Therefore, macrotexture is controlled by the shape, size, gap width, layout, and gradation of the coarse aggregates [16].
OMAINTEC Journal
(Journal of Scientific Review)
Developing Performance Models
Pavement performance prediction models are essential for a complete pavement management system. Condition prediction models are used at both the network and project levels management. At the network level, prediction models uses include condition forecasting, budget planning, inspection scheduling, and work planning. One of the most important network uses of prediction models is to conduct “what if” analysis to study the effects of various budget levels on future pavement conditions [17].
Performance modeling requires historical record of the objective function (performance) variation with age (time). If such record is not available, then the alternative method is to use family method. The method consists of the following steps [10]:
- Define the pavement family such as major, collector or service roads.
- Filter the data for errors or mistakes.
- Conduct data outlier analysis. Data within X ± 2σ should be included for family model development.
- Build the family model using regression technique.
Mostaqur Rahman with his coauthors [18] developed pavement performance evaluation models using data from primary and interstate highway systems in the state of South Carolina, USA. In their research, twenty pavement sections were selected from across the state, and historical pavement performance data of those sections were collected. In their developed models, four different performance indicators were considered as response variables: Present Serviceability Index (PSI), Pavement Distress Index (PDI), Pavement Quality Index (PQI), and International Roughness Index (IRI). Annual Average Daily Traffic (AADT), Free Flow Speed (FFS), precipitation, temperature, and soil type were considered as predictor variables. Results showed that AADT, FFS, and precipitation have statistically significant effects on PSI and IRI for both Jointed Plain Concrete Pavement (JPCP) and Asphalt Concrete (AC) pavements.
Case Study- Pavement Performance Evaluation of Dubai International Airport
To demonstrate the use of Pavement Performance Evaluation in general and for airports in specific, the performed pavement evaluation of Dubai International Airport in the period 2016 – 2017 by Arab Center for Engineering Studies (ACES) is explained in this paper. For the confidentiality of the obtained tests results, only performed evaluation tests in Dubai International Airport will be explained in this paper with examples of normally obtained results that are from any of the evaluated airports by ACES.
Structural evaluation
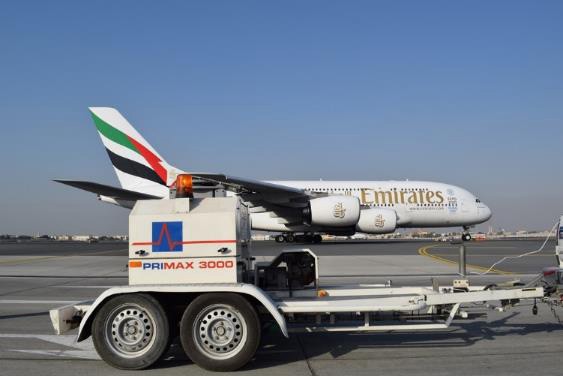
The used Falling Weight Deflectometer in the structural evaluation study was the Super Heavy Falling Weight Deflectometer (SH-FWD). It is capable of applying loads to the pavement that stimulate moving heavy wheel loads in both magnitude and duration up to 300 kN, Photo 1. The used SH-FWD can be used for
Photo 1: Used SH-FWD in pavement structural evaluation.
OMAINTEC Journal
(Journal of Scientific Review)
deflection measurements on airports, roads and granular surfaces. It is equipped with T-beam extension
bar for measurements behind and next to loading points on concrete slabs; to evaluate deflection load transfer efficiency (LTE) factor from the loaded slab to the unloaded slab for rigid pavement slabs and flexible pavement overlaid rigid pavement slabs.
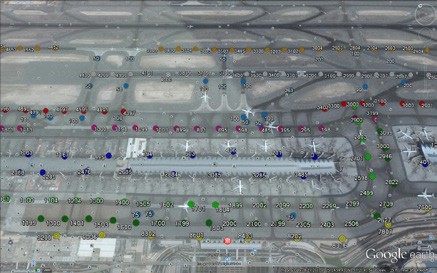
The structural evaluation study included both North and South Runways with their Associated Taxiways, Taxilinks, Rapid Exits and Holding Bays, in addition to General Service Equipment (GSE) roads. A total of 2020 FWD test points were selected to conduct the deflection tests. Locations of some of the tested points on Google Maps view for Dubai International Airport are shown in Figure 1. Test points on the runways were at 6.25m, 2.9m and 1.9 offset distances to the right and left from the center line at 50m and 100m spacings. While on the taxiways, taxi-links, rapid exits and holding bays they were at 2.9m and 6.25m offset distances to the right and left from the center line at 100m and 200m spacings. On the GSE Roads, FWD tests were performed in the center of both traffic lanes at 200m spacing. On the concrete slabs, FWD tests were performed on the center, corner and edge of the selected concrete slabs. Edge and corner slabs FWD tests were used to calculate the load transfer efficiency (LTE) between the slabs.
Figure 1: Locations of some of the tested points on Google Maps view of Dubai International Airport.
OMAINTEC Journal
(Journal of Scientific Review)
The measuring cycles at each FWD test point consisted of four drops. One set drop and three measuring drops. The set drop was used to adjust the FWD plate position on the pavement surface. The three other drops were the measuring drops. The latter drops were compared with each other and with the maximum allowable deflection of the FWD geophones, i.e., 2200 micron. If the deflection data looked suspicious, or the deflection difference for any sensor was greater than 5% or 5 microns -whichever was smaller- or the actual test loads were not within 5% of the target load, the test sequence was repeated at the same location or at an adjacent location at the same levels of loads. If the measured results were acceptable, then the results were stored and the operator would move to the next measuring point. Testing was not conducted near cracks. The used FWD load in evaluating the runway and taxiways was 215 KN, and was 55 KN for the GSE roads.
RoSy DESIGN for Aircraft Loads software was used to calculate the pavement layers’ moduli and Pavement Classification Numbers (PCN) at the different test points. Figure 2 shows a typical output of RoSy DESIGN software. Figure 2 includes calculated E moduli values for each pavement layer, layer 1 is the asphalt layer, layer 2 is the granular base layer, Layer 3 is the granular subbase layer and layer 4 is the subgrade layer, thicknesses of each pavement layer, pavement type and calculated PCN values and Airplane Classification Number (ACN) values for the Critical Design Aircraft.
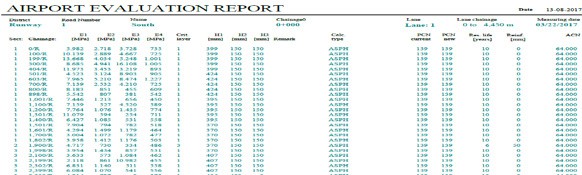
Figure 2: Obtained typical FWD analysis report.
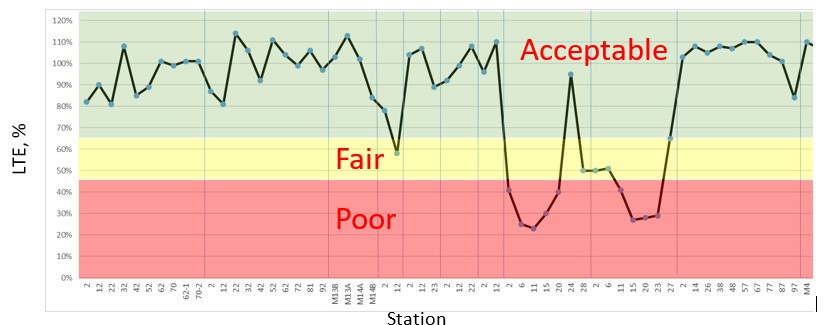
Figure 3: Distribution of the obtained LTE values.
OMAINTEC Journal
(Journal of Scientific Review)
LTE were calculated for both corner and middle of edge of the slab locations and were classified according
to FAA AC150/5370-11B “Use of Nondestructive Testing in the Evaluation of Airport Pavements” into “Acceptable”, “Fair” and “Poor” conditions [19], Figure 3.
Functional evaluation
Australian Road Research Board (ARRB) laser profiler, Photo 2, was used to obtain roughness of the runways, taxiways and rapid exits. The system is a portable data collection roughness measurement equipment consisting of a precision laser profiler, combined with a high-resolution camera. The laser profiler is a World Bank Class 1 profiler, consisting of two precision laser sensors and accelerometers that are used to compensate for vehicle body movement.
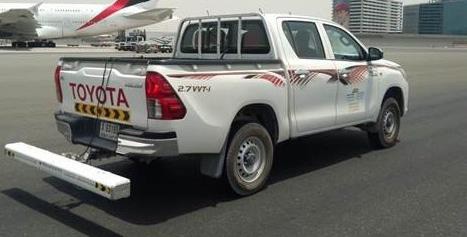
Photo 2: Used Laser Profiler in pavement roughness evaluation.
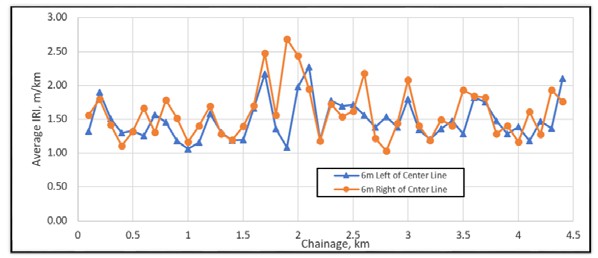
The IRI measurement lines were limited to the central strip of the tested facility (i.e. 2 lines per facility in the most favorite direction of traffic, at 6m offsets from each side of the centerline). Roughness data analysis was performed by calculating average IRI values for each 25m, 100m and 200m, lengths for each sensor. Figure 4 shows Variation of average IRI values for each test path, i.e. 6 m left of the Center line and 6 m right of the Center line.
In addition to IRI calculation, the laser profiler Hawkeye analysis program produced ERD output files for each test run. The produced ERD files were analyzed using ProVAL computer program to calculate the Rolling Straight Edge (RSE) values for each section.
OMAINTEC Journal
(Journal of Scientific Review)
Figure 4: Variation of average IRI values for each test path.
The RSE simulation in ProVAL simulates RSE measurement from profiles collected using inertial profilers. It can determine the vertical deviation between the centre of a straightedge and the profile for every increment (2.5cm) in the profile data. For all the collected roughness data, RSE indices were computed and scallops were identified.
The default input values that were used in ProVAL software were:
- Straightedge Length: 3.05m (10.0ft).
- Deviation Threshold: This is the threshold values to determine out of limit areas 3.00mm (0.118”).
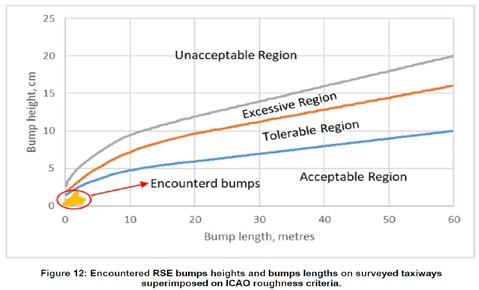
Figure 5 shows the obtained RSE values superimposed on the acceptance criteria for surface evenness according to International Standards and Recommended Practices (ICAO) Annex 14 – Aerodromes_V1_ Aerodrome Design and Operations (7th Edition) [20].
Figure 5: Encountered RSE bumps heights and bumps lengths on surveyed taxiways superimposed on ICAO roughness criteria.
OMAINTEC Journal
(Journal of Scientific Review)
The produced ERD files from the laser profiler analysis program were analyzed using ProFAA computer program to calculate the “Boeing Bump Index” (BBI) for the surveyed taxiways. “ProFAA” is Federal Aviation Administration’s computer program for computing pavement elevation profile roughness indices. BBI is determined by computing the bump height and bump length for all straightedge lengths for all sample points in the profile. For each straightedge length, the limit of acceptable bump height is computed for the computed bump length.
For each straightedge length, the ratio (measured bump height) / (limit of acceptable bump height) is calculated. The BBI for the selected sample point is the largest computed ratio (Index) for all computed straight edges for the selected sample point. The specified Boeing Bump Index limits in FAA AC No: 150/5380-9 Guidelines, specifies the bump as “Acceptable” if it falls in the “Acceptable Zone”, i.e., if the computed BBI value is less than 1.0, while if computed BBI is greater than 1.0, it falls in the “Excessive” or “Unacceptable” zones [9]. Figure 6 shows the variation of BBI values along one of the surveyed taxiways.
Figure 6: Variation of BBI values for both sensors along surveyed taxiway (6m North of Center Line).
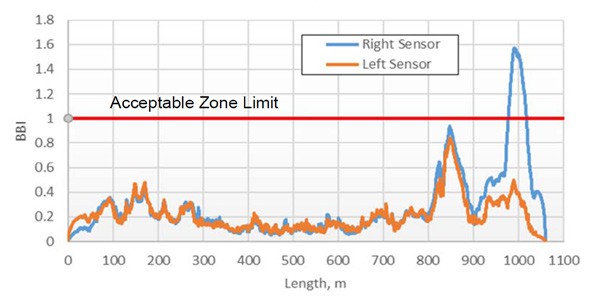
OMAINTEC Journal
(Journal of Scientific Review)
Surface condition evaluation
The PCI method was used in evaluating the included pavements of Dubai International Airport, Photo 3. ASTM D5340-12 “Standard Test Method for Airport Pavement Condition Index Surveys” was followed in evaluating the runways, taxiways, taxilinks and rapid exits. While ASTM D6433-18 “Standard Test Methods for Roads and Parking Lots Pavement Condition Index Surveys” was used in evaluating the GSE roads surrounding the internal airport facilities. In addition, ASTM E2840 − 11 (2015) “Standard Test Methods for Pavement Condition Index Surveys for Interlocking Concrete Roads and Parking Lots” was followed in evaluating the interlocking concrete GSE roads.

Photo 3: PCI Evaluation of the GSE roads.
OMAINTEC Journal
(Journal of Scientific Review)
The first step in the PCI evaluation was dividing the included pavement parts into three networks, Network One for the runways, associated parallel taxiways and their taxilinks, Network Two for the associated taxiways around concourses with their taxilinks and Network Three for the GSE roads. Selected Networks were divided into Branches of readily identifiable parts of the pavement with distinct use. The Branches were divided into Sections of same construction history, traffic, pavement rank (or functional classification), drainage facilities, shoulders, condition and size. Finally the Sections were divided into Sample Units.
The Sample Units that were selected for inspection were selected according to the specified sampling procedure in each of the corresponding ASTM Method to obtain a statistically adequate estimate (95% confidence) of the PCI of the section.
All the selected Sample Units for inspection were inspected and the PCI values of the inspected Sample Units with their corresponding Sections were calculated using Paver Version 6.5.7 software, Figure 7.
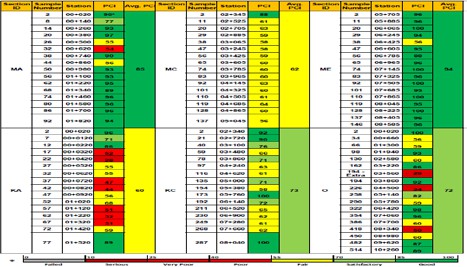
![]()
Figure 7: Calculated Sample Units and corresponding Sections’ PCI values.
Total distresses quantity tables for each Section were generated and pavement maintenance assignment procedure was assigned for each Section according to obtained PCI value for that Section or Subsection, Figure 8.
Safety evaluation
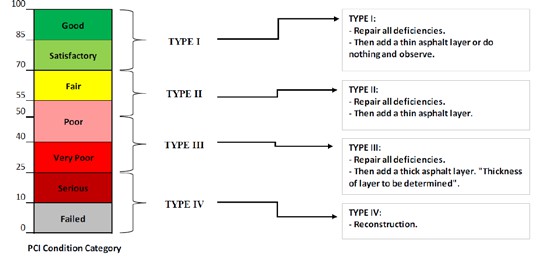
OMAINTEC Journal
(Journal of Scientific Review)
Figure 8: Pavement maintenance assignment procedure for the surveyed Sections.
The operator of any airport with significant jet aircraft traffic should schedule periodic friction evaluations of each runway end. Every runway end should be evaluated at least once each year. Depending on the volume and type (weight) of traffic on the runway, evaluations will be needed more frequently, with the most heavily used runways needing evaluation as often as weekly. According to FAA Advisory Circular No: 150/5320-12D [21], all airports with turbojet traffic should own or have access to Continuous Friction Testing Equipment (CFME), not only is it an effective tool for scheduling runway maintenance, it can also be used in winter weather to enhance operational safety. Figure 9 shows a sample of a generated variation of friction coefficient graph for a runway to categorize its friction coefficients into “Acceptable”, “Maintenance Planning” and “Minimum Acceptable Friction Level” zones.
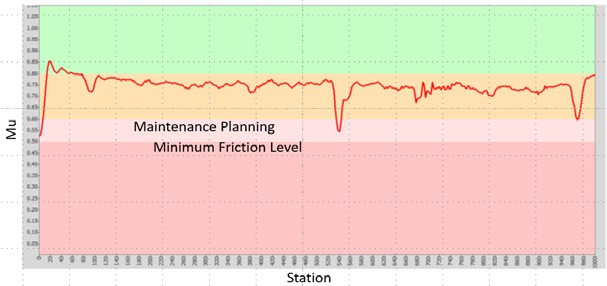
Figure 9: Sample of a generated variation of friction coefficient graph for runway surface.
OMAINTEC Journal
(Journal of Scientific Review)
References
- A. Patted, Vinodkumar, Shivaputra and Poornima. “Pavement Performance and Functional Evaluation for Selected Stretches”, IJSRD – International Journal for Scientific Research & Development|, Vol. 4, Issue 03, available online, (2016).
- Y. O. Adu-Gyamfi, N. O. Attoh-Okine and C. Kambhamettu. “Functional Evaluation of Pavement Condition Using a Complete Vision System”, Journal of Transportation Engineering, Volume 140 Issue 9, pp. 1-10, (2014).
- B. Huang, T. F. Fwa and W. T. Chan. “Pavement-distress data collection system based on mobile geographic information system”, Transportation Research Record 1889 , Transportation Research Board,Washington, DC., (2004).
- M. Sayers and S. Karamihas. “The Little Book of Profiling”, The Regent of the University of Michigan, Michigan, 1998.
- T. Al-Rousan and I. M. Asi. “Utilization of Reclaimed Asphalt Pavement (RAP) in Jordan Roadways,” Proceedings of The First International Syrian Road Conference, Ministry of Transport, Damascus, Syria, (2007).
- R. L. Baus and W. Hong. “Development of profiler-based rideability specifications for asphalt pavements and asphalt overlays”, Federal Highway Administration, Report GT04-07, (2004).
- Federal Highway Administration (FHWA). Pavement smoothness methodologies, FHWA-HRT-04-061-145-91, <www. fhwa.dot.gov/pavement/smoothness/index.cfm>, (2004).
- Abu Dhabi City Municipality, Department of Municipal Affairs. “Standard Specifications for Roads”, Version 2, Abu Dhabi, UAE, (2014).
- Federal Aviation Administration. “Guidelines and Procedures for Measuring Airfield Pavement Roughness,” U.S. Department of Transportation, AC No: 150/5380-9, (2009).
- M. Y. Shahin and J. A.Walter. “Pavement Maintenance Management for Roads and Streets Using PAVER system”, US Army Corps of Engineers, Construction Engineering Research Laboratory (USACERL), Technical Report M-90/05, USA, (1990).
- M. Y. Shahin. Pavement management for airports, roads, and parking lots, Springer, New York, USA, (2005).
- I. Kutkhuda. “Development a Pavement Maintenance Management System for Greater Amman Municipality”, Arab Center for Engineering Studies Report, SPR900013, Amman, Jordan, (2009).
- I. M. Asi. “Evaluating Skid Resistance of Different Asphalt Concrete Mixes,” Building and Environment Journal, Scotland, Volume 42, Issue 1, pp. 325-329, (2007).
- R. Haas, R. Hudson and J. Zaniewski. “Modern Pavement Management,” Krieger Publishing Company Malabar, FL, USA, (1994).
- Pavement Management Committee. “Pavement Management Guide,” Roads and Transportation Association of Canada, Canada, (1977).
- T. Fwa, Y. Choo and Y. Liu. “Effect of aggregate spacing on skid resistance of asphalt pavement,” The Journal of Transportation Engineering, ASCE, 129 (4): 420–6, (2003).
- H. I. Al-Abdul Wahhab, R. H. Malkawi, I. M. Asi and J. Yazdani. “Dammam Municipality Pavement Management System (DMPMS)”, The 6th Saudi Engineering Conference, KFUPM, Dhahran, pp. 455-368, (2002).
- M. Mostaqur Rahman, M. Majbah Uddin and S. L. Gassman. “Pavement performance evaluation models for South Carolina”, KSCE Journal of Civil Engineering, Volume 21, Issue 7, pp 2695–2706, (2017).
- Federal Aviation Administration. “Use of Nondestructive Testing in the Evaluation of Airport Pavements,” U.S. Department of Transportation, AC No: 150/5370-11B, (2011).
- International Civil Aviation Organization (ICAO). “Annex 14 – Aerodromes_V1_Aerodrome Design and Operations,” International Civil Aviation Organization, 7th Edition, (2016).
- Federal Aviation Administration. “Measurement and Maintenance of Skid-Resistant Airport Pavement Surfaces,”
U.S. Department of Transportation, AC No: 150/5320-12D, (2016).
OMAINTEC Journal

(Journal of Scientific Review)
Building Maintenance Optimisation towards the Future of Building Information Model BIM
Samir M Al Shariff
Electrical Engineering Department Taibah University, Madinah, Saudi Arabia
- Building maintenance is acknowledged as an important area that is worthy of study. It is broadly appreciated that the cost of maintenance of a building over its life can be much higher than its initial construction cost. Evans et al [1] study of the long term costs of owing and using buildings suggested a ratio of 1:5:200 relating the initial cost of the building to that of maintenance and operations respectively. Weather this ratio exaggerates the maintenance cost that can be open for debate, but maintenance cost over the life of the asset depends on the type of building and its use. For example in a study of post offices in Japan based on using life Cycle cash flow, the data suggests much lower ratio [2]. The ratio of initial cost to the cost of repair and improvement and to operating cost (utilities and maintenance) of post offices increases from 1: 0.21: 0.55 to 1: 0.65: 1.11 to 1: 1.28: 2.22 for 20, 40 and 60 years old buildings respectively. It is important to note the different terms used by Minami [2] e.g. they refer to maintenance cost as those relating to equipment maintenance, cleaning, security and refuse disposal costs. While this ratio is much lower than that suggested by Evans et al [1] it remains highly significant.
Irrespective of its cost, building maintenance is essential to maintain its functionality. But according to Barbour Index [3] the estimated market for Maintenance, Repair and Improvement (MRI) is £28bn compared with £10bn for new build. Wood [4] presents brief introduction to the recent history of building maintenance in the UK. He discusses the public policy with regard to building construction and maintenance from the focus on reconstruction following WWII, the slum clearance, introduction of building regulations, the modernisation of slums to the privatisation of council houses and the introduction of the Private Finance Initiative (PFI) and the Public/Private Partnerships to organise involvement of the private sector in the public sector construction work that was previously carried out by councils.
The first aim of this paper is to present an analysis of both the modern maintenance advances and the building maintenance research at presented with the gaps between them are identified. The paper then explores how Building Information Modelling (BIM) can be used to support building maintenance given the possible interaction between BIM, Computer Aided Facility Management (CAFM) and Computerised Maintenance Management Systems (CMMS) software. The paper is concluded with a proposed building maintenance framework.
Asset Management: The State Of The Art
OMAINTEC Journal
(Journal of Scientific Review)
Maintenance is an important part of operations management of any organisation. In industry, plant maintenance represents the focus of such activities. Its objective is generally acknowledged as being to maintain the condition of plant/ equipment at a state that allows delivery of its functions effectively and efficiently. Apart from industry, other types of organisations also have interests in maintenance of its assets including equipment used, buildings and its contents e.g. air conditioning and lefts.
Generally speaking and until the 1970s, maintenance was viewed as an area that no one wishes to get involved in. Instead, there was a tendency for association with production that produces goods or services that can make positive contribution to the organisation. In fact maintenance was thought of as the last uncontrolled area in the majority of business and a bastion of inefficiency [5].
In the past three decades organisations recognised the importance of maintenance management and researchers developed a huge body of knowledge in this area that ranges from the development of maintenance concepts to the specific management techniques and focus on case studies.
The structure of the Complex System Maintenance Handbook (Kobbacy and Murthy [6]) suggests that one can classify research in this area, excluding case studies, into four main areas: concepts and approaches, methods and technique, problem specific models and management. There is a substantial body of knowledge accumulated in each of these areas. More details are shown later in Figure (1).
Building Maintenance Research
Little attention was given to building maintenance management and planning until the 1960s. From the mid-1960s studies started to emerge in this area. Examination of two books published in the 1970s on building maintenance reveals the areas of interest and indeed the significant advances achieved by that time. The book on Building Maintenance Management by Lee [7] shows appreciation of the complexity of this area and its social and economic importance and the usefulness of utilising management techniques. The chapter on planning shows appreciation of the increasing cost resulting from the delay in undertaking maintenance actions and hence the importance of inspection and indeed the scheduling and the contingency (planned/ preventive) maintenance. The edited book on Developments in Building Maintenance-1[8] reveals the substantial advancements in this area and the emerging topics that remain to be of current research interest to date. Examples cover the decisions models and statistical aids in maintenance management. Techniques discussed include discounting, cost benefit analysis, mathematical programming and indeed the early models that were developed to optimise maintenance activities e.g. determining optimal inspection activities based on the pioneering work of Jardine [9] which continues to be reprinted to date.
- The Gap between Modern Maintenance Advances and Building Maintenance Research
Figure (1) shows the areas of maintenance research according to the classification of Kobbacy and Murthy [6]. A review of the method and approaches developed in the maintenance domain which are typically applied in plant maintenance have identified the methods which are either not been applied or its potential has not been fully explored in building maintenance.
It is important to indicate that many of these methods and techniques while may have not been directly applied in building maintenance situations they are applicable to mechanical and electrical equipment that are used in buildings including lifts, air conditioning systems, water pumps etc. Examples of these techniques include conditions based maintenance, preventive maintenance, reliability predictions and accelerated testing etc. These equipment can typically be grouped under a broad building element namely
OMAINTEC Journal
(Journal of Scientific Review)
“services”.
However building maintenance goes well beyond services. For example Elharam et al [10] identifies 11 building elements e.g. floor boards, windows, plaster, walls and doors. Our discussion below will focus on these building elements.
From the previous discussion one can identify the areas that are not explored fully in building maintenance and which have good potential in improving building maintenance. Broadly speaking these areas, which are hatched in Fig 1, include:
-
- Maintenance concepts.
- RCM
- Condition based maintenance.
- Maintenance based on limited data.
- Artificial Intelligence in maintenance.
- Maintenance of multi-component systems
- Delay time modelling.
- Maintenance outsourcing
- Computerised maintenance management systems (CMMS).
- Risk assessment.
- Maintenance performance measurements system
Fig ( 1 ) The state of the art and gaps in building maintenance (hatched area indicates potential area of
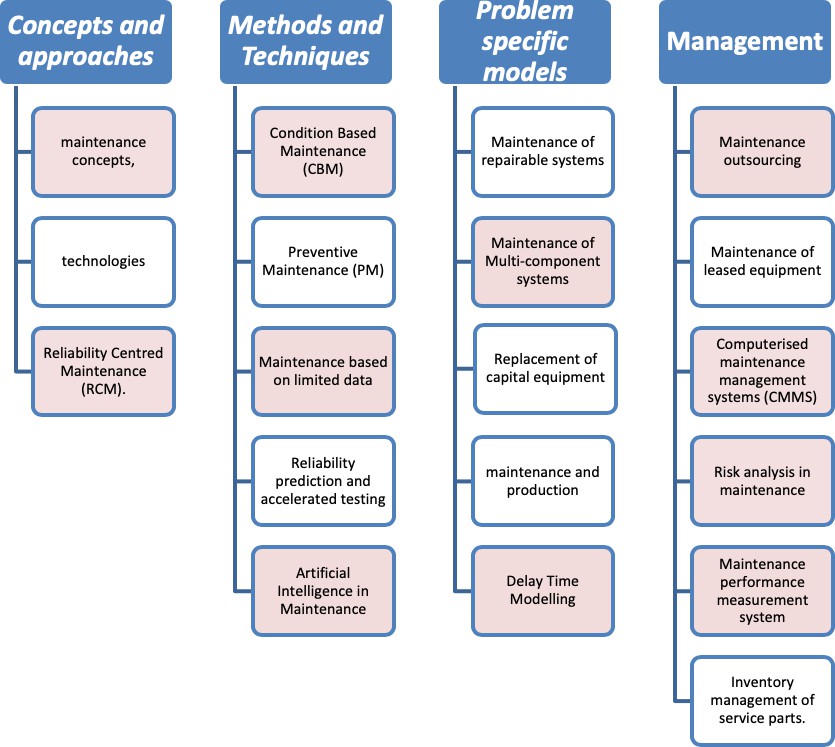
OMAINTEC Journal
(Journal of Scientific Review)
development in building maintenance).
Therefore there is an obvious need to develop a building maintenance concept that guide the strategy of planning and managing building maintenance. An attempt is presented later in this paper. There is also a need to develop more work on the systematic application of RCM in this area.
In the area of methods and techniques the authors believe that a significant benefit can be gained from expanding CBM and the promising area of artificial intelligence techniques. Utilising the most promising statistical techniques on using limited data can be most useful in overcoming typical situations where data are scarce.
Given the complexity and interdependence of building elements it is obvious that utilising the powerful multi- component techniques in optimising building maintenance can be most useful. The same applies to the Delay Time modelling techniques, which were originally developed in the context of building maintenance. These techniques are particularly useful in timing the maintenance action to avoid undesirable and costly failures.
The development and application of maintenance performance measurement systems are essential to assess and develop effective and efficient maintenance policies. Exploring the benefits of maintenance outsourcing is another area that can help in achieving effective maintenance at lower costs. The use of CMMS will be discussed in the next section given the current interest and future expansion in using BIM.
Maintenance and Building Information Modelling (BIM)
Building Information Models or BIM was coined in the early years of the 21st Century. There are many definitions for BIM, but essentially it is a digital representation of the physical and functional characteristics of a facility [11]. BIM covers all stages of a building from design and construction to operations and maintenance.
It is expected that maintenance data in BIM models will build-up over the coming few years with the use of BIM which can potentially help more effective building operations and maintenance. The availability of such data will also lead to better managed buildings by reducing both energy use and waste. It is important to start understanding how such information will be used in maintenance management and indeed how the information in BIM can be used to project the maintenance requirements as early as the design phase. In other words the availability of this integrated system will lead to consideration of maintenance requirements at the design stage and hence maintenance cost will influence building design. Furthermore BIM will provide appreciation of maintenance requirements from the design stage. Large organisations now look primarily at facility performance rather than the physical structure [11]. For example the USA General Services Administration (GSA) has recently awarded contract to design, install and maintain major power facility.
BIM, CAFM and CMMS
These are 3 different categories of computerised systems that can help achieve effective building maintenance; Building Information Model (BIM), Computer Aided Facility Management (CAFM) and Computerised Maintenance Management systems (CMMS). The scope of BIM is broader than that of CAFM which automat many of the FM functions and results in cost savings and improved utilization of assets throughout the entire lifecycle. In particular, CAFM provide and maintain information on floor plans, space
OMAINTEC Journal
(Journal of Scientific Review)
utilization, energy consumption and equipment location [11]. CAFM scope is wider than that of the more maintenance specific software CMMS which is a computer software developed to provide support to maintenance managers in planning, management, and administration of the maintenance function with a view to improve its effectiveness. Each type of these software have a role in building maintenance and indeed BIM can be viewed as enabler to both CAFM and CMMS by providing understanding of the facility design and operation, its maintenance requirements and much needed data accumulated while operation.
Integrated CMMSs became the theme for recent development e.g. with asset management systems using costs, production quality, efficiency and facility condition in making decisions about productive and proactive maintenance strategies. Artificial Intelligence (AI) has been identified as a tool to achieve this integration. In a similar manner one would expect the integration of BIM, CAFM and CMMS leading to a more efficient management of buildings throughout its like cycle.
Figure (2) represents the possible interaction between the 3 types of software in supporting the building maintenance and indeed the wider aspects of facility management and other stages of building lifecycle. For example the decision support offered by CMMS can lead to better facility management. It is not surprising, therefore, that some commercial software are classified as both CAFA and CMMS.
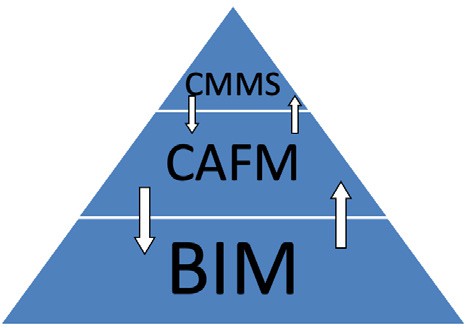
Fig (2 ) Integration of building management tools; BIM, CAFM and CMMS
OMAINTEC Journal
(Journal of Scientific Review)
CONCLUSIONS
This paper is concerned with the optimisation of building maintenance. An analysis of the methods and approaches developed in maintenance and building research reveals significant gaps between building maintenance research and the recent advances in the maintenance field typically applied in plant maintenance. We have identified 11 approaches/ areas of maintenance research and development that are either not fully utilised or else not explored in building maintenance. It is hoped that such list will help researchers in developing these areas and exploring its benefits in building maintenance. The potential benefits from the current development and implementation of BIM on building maintenance have been discussed. We believe that over the coming few years with the implementation of BIM significant amount of maintenance data will be accumulated. There is a need to develop methods and approaches that can help integrating BIM with the other computerised systems such as CAFM and CMMS to realise the benefits of BIM implementation in building maintenance. The development of integrated computerised intelligent systems is a potential approach to deal with this issue.
References
- R. Evans, R., Haryott, R., Haste, N., and Jones, A. (1998) The long Term Costs of Owning and Using Buildings, Royal Academy of Engineering, London.
- Minami, K. (2004) Whole life cost of post offices in Japan, based on a survey of actual conditions and consideration of investment corrections, J of Facilities Management, V2, No 4 pp 328-407.
- Barbour Index, (1998) The building maintenance and refurbishment market: summary, Barbour Index, Windsor.
- Wood, B. (2005) Towards innovative building maintenance, Structural Survey, V 23, No 4, pp 291-297.
- Ward, A. (19880 The micro as maintenance monitor. Account. J. Inst. Chart. Account. Engl. Wales: 127-128.
- Kobbacy, K. and Murthy, P. (Editors), Complex Systems Maintenance Handbook, Springer, 2008.
- Lee, R., Building Maintenance Management, Crosby Lockwood Staples, London, 1976.
- Gibson, E. J., Editor, Developments in Building Maintenance-1, Applied Science Publishers, 1979.
- Jardine, A.K., Maintenance, Replacement and Reliability. Pitman publishing, London, 1973.
- El-Haram, M.A., and Horner, M.W. (2002) Practical application of RCM to local authority housing: a pilot study, Journal of Quality in Maintenance Engineering, 8( 2) pp 135-143.
- Ahamed, S.S., Neelamkavil, J. and Canas, R. (2010) Impact of building information modelling in facility maintenance management. The E-SIM 2010 Conference, Winnipeg, Canada.
OMAINTEC Journal

(Journal of Scientific Review)
RISK ASSESSMENT IN MAINTENANCE ACTIVITIES: A SPECIALIZED METHODOLOGY THROUGH A SIMPLIFIED APPROACH
Dr George Scroubelos, ME
RMS SPPCC, Greece
Maintenance is not a sector, but it is a high-risk activity carried out in all sectors and all workplaces. The European Union Occupational and Health Administration (EU-OSHA) maintenance activities were recognized as being the riskiest jobs performed among the conventional ones. The figures and major accidents show that 10 to 15 % of all fatal accidents at work and 15 to 20 % of all accidents are connected with maintenance [1,2], the main causes being the maintenance works special characteristics as analyzed in the following as well as the difficulty of employing an effective integrated approach within the already existing Health & Safety Management Systems [3].
Managing workplace incidents, which actually is translated to preventing them at a level as low as reasonably practical (ALARP), starts with planning which in turn includes a Risk Assessment of the activities under review. This is the first stage of the problem Safety Professionals encounter. There is no specific Risk Assessment methodology, not even as a framework, that could be as detailed as appropriate for activities so complex, diverse and specific entailing such a rich combination of simultaneous risks. The existing methodologies are either too simple to cover the maintenance jobs or too complicated to be implemented or continually updated by the maintenance personnel itself once the Safety Professional or Consultant delivers the Risk Assessment Study [4,5].
This paper presents a methodology that has been gradually developed and resolved these issues in practice and is currently being implemented in mainly high-hazard industries where maintenance works are mostly conducted in-house and include mostly high risk tasks.
Additionally, in spite of the fact that the reader of this paper may be quite knowledgeable on the Risk Assessment methodologies, the author presents his case by including a first stage where the principal terms used in a Risk Assessment Study are clarified, their correlation explained and the Risk Assessment methodology analytically depicted since even in this area there is still much ambiguity. At this stage also useful tools are cited for the Safety Professionals’ facilitation, use and, why not, improvement.
Risk Assessment Methodology
EU-OSHA : European Union Occupational H&S Association STF : slips, trips, falls
OMAINTEC Journal
(Journal of Scientific Review)
Abbreviations
RA
: Risk Assessment
RAS : Risk Assessment Study
MAs : Maintenance Activities H&S : Health & Safety
PIS
: Probable Incident Scenario
ALARP : As Low As Reasonably Practical/ Possible
PPE : Personal Protective Equipment
JSA
: Job Safety Analysis
Terminology & Tools Library
Even in the most recent editions of the standards governing the H&S requirements, the terminology does not seem to be consistent [6,7,8]. In other H&S professional editions popular among the H&S professionals the same inconsistency appears [9,10]. Therefore, for the purposes of this paper the following terminology is adopted, which is also used by the author when conducting RAS’s. The whole approach needs to be linked to the business objectives of achieving their goals by reducing the probability of loss.
Maintenance Actyivities : A broader term to denote the extent and diversity of maintenance works Affected Party : Any employee, visitor, contractor or bystander present during an Organization’s activity
Loss: Any non-recurring removal of, or decrease in, an asset or resource hence, in H&S terms, directly linked to the consequences of an incident.
Incident Scenario: a foreseen undesirable event that could result in a more or less severe accident or occupational disease which, in turn, results in an affected party’s psychosomatic health degradation.
Probable Incident Scenario : an incident scenario foreseen by the Organization or its Risk Assessor’s that may result in loss.
Hazard or Hazard Source : Anything that has the potential of causing an incident to the employees (object, substance, tool, machinery, equipment, installation, situation, work, behaviour etc.).
Danger : The property that makes a hazard dangerous (slipperiness, speed, sharpness, reactivity, intensity, voltage, height difference, weight, tension, temperature, carelessness etc.) when used during an activity.
Incident : The interaction (contact/ exposure) of an employee to danger (fall, contact with hot surfaces, exposure to noise, impact with moving objects etc.).
Consequence/ Hazard Effect : The form of employee health degradation (fracture, burn, bruising, shock,
A hazard source has a natural substance (tangible or intangible) therefore it always exists.
OMAINTEC Journal
(Journal of Scientific Review)
loss of consciousness, irritation etc.).
Risk : The combined probability (uncertainty) for an incident scenario to happen during an activity, based on the following parameters:
The incident scenario’s health consequences severity, without taking into account any existing or recommended measures
The frequency of exposure to the activity’s dangers
The likelihood of the probable incident scenario taking into account the existing measures with respect to the full range of measures that must be implemented
Necessary clarifications are presented on the difference among Hazard Source – Danger – Risk:
The danger appears when the hazard is used therefore it exists only during an operational activity.
The risk however expresses the combined probability for an incident to happen during the operational activity and therefore it depends on the effectiveness of the implemented measures.
Necessary clarifications are presented on the difference between Risk– Likelihood:
Risk (and therefore the risk index in a RAS) expresses the level of probability of an incident to occur during a specific operation taking additionally into account the operational (job/ task) conditions i.e. the frequency of employee exposure, the incident scenario severity, the number of employees affected etc. The variation of this
Likelihood (and therefore the likelihood index in a RAS) expresses the level of probability of an incident to occur during a specific operation due to the lack of H&S measures implementation.
In the following tables with lists of the RA parameters are presented that could to be used as data libraries for the H&S Risk Assessors.
|
Hazard Source List |
|
|
Floors |
Loads |
|
Hot/ cold objects |
Confined Spaces |
|
Chemicals |
Low density materials |
|
Machinery |
Pests, animals, rodents |
|
(Tools (hand, power |
Microorganisms |
|
Equipment |
Microclimate |
|
(.Network lines (cabling, piping, ducts etc |
Workplace organization |
|
Installations |
(Work organization (psychosocial |
|
Structural installations |
Combustibles + ignition sources |
|
Vehicles |
Behaviour |
Table 1: Hazard Source list (the underlined hazard sources may also cause occupational diseases)
OMAINTEC Journal
(Journal of Scientific Review)
|
Danger List |
||
|
Slipperiness |
Poor visibility |
Low density |
|
Obstruction of movement |
Radiation |
Poor illumination |
|
Height difference |
Electrical voltage |
Air draught |
|
Temperature extremes Reactivity |
Asphyxiating atmosphere (lack of O2/ toxic substanc- (es presence |
Vibration Sedentary/ static work |
|
Movement/ Inertia |
Humidity |
Monotony |
|
(Sharpness (edge/ point |
Insufficient ventilation |
Stressfulness |
|
Particle release |
Infectiousness |
Intensiveness |
|
(Tension (belt/ spring |
Storage height |
|
|
Weight |
Center of gravity position |
|
|
Pressure |
||
|
Vacuum |
||
|
Noise |
||
Table 2: Danger list (the underlined dangers may also cause occupational diseases)
Table 3: Probable Incident Scenarios list (the underlined PIS may also cause occupational diseases)
OMAINTEC Journal
(Journal of Scientific Review)
Inhalation of chemicals Swallowing of objects/ chemicals Exposure to biohazards
Fire Explosion
Entrapment/ asphyxiation by low density/ asphyxiant materials
Overexertion
Exposure to adverse working environment ((microclimate, physicochemical agents
Working under adverse psychosocial environ- ment
(Slipping at (& falling at/ to/ from
Tripping/ stumbling at (& falling at/ to/ (from
Bumping/ knocking/ hitting into/ against (protruding) objects/ surfaces at the same level
Hit/ struck/ crushed by falling/ moving objects
Falling from another level
Contact with elements under voltage
Contact of the skin/ eyes with sharp/ pointed objects
Contact of the skin/ eyes with hot/ cold surfaces/ chemicals
Probable Incident Scenarios (PIS) List
The Risk Assessment Study (RAS)
The RAS methodology used in most industrial applications is more demanding regarding its analysis. The 5-step process proposed by EU-OSHA proved to be insufficient in practice, except for very low risk Organizations. The author has successfully implemented a more detailed 10-step approach which was gradually improved and depicted in Figure 1 below; on the right-hand side, the corresponding involved parties’ involvement is depicted in which the importance of the Organization’s contribution at the 7 first stages is apparent as, no matter how knowledgeable a H&S Expert may be, the specific Organizational input RA data must be provide by the Organization whose Affected Parties are more familiar with their everyday tasks.
Figure 1: The improved 10-step Risk Assessment Study approach that must be used for industrial and other high-risk operations
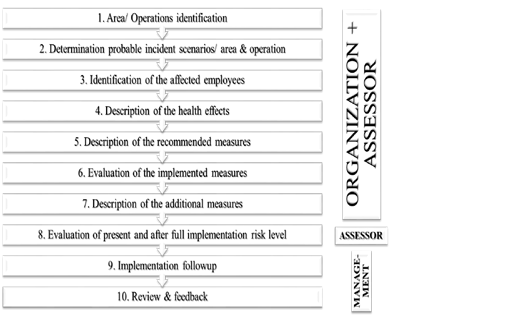
OMAINTEC Journal
(Journal of Scientific Review)
Since the objective of a RAS is to identify the broadest possible range of applicable measures so as to minimize risk to an ALARP level, a table of the categories of H&S measures usually applied is presented in Table 4.
.8
Measurements
.7
Safety Equipment
.6
Signage
niques (Training, Meetings, Promo-
(tional Activities
.5
Communication Tech-
.4
PPE
(Procedures/ Guidelines/ Work In-
(structions/ Safe Methods of Work
.3
H&S Management System
.2
Specifications
.1
Legislation
H&S Measures List
Table 4: H&S Measures list to be more analytically specified as an output of the RAS
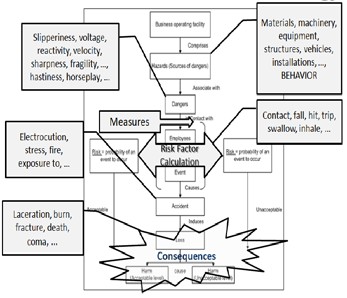
OMAINTEC Journal
(Journal of Scientific Review)
The above tools, presented in Tables 1-4, are absolutely necessary to assist the Risk Assessor so as to
conduct a RAS as complete as possible for any kind of activity, irrespective of the complexity degree; the methodology that this Risk Assessor must implement with the aid of the above tools is shown in Figure 2 below.
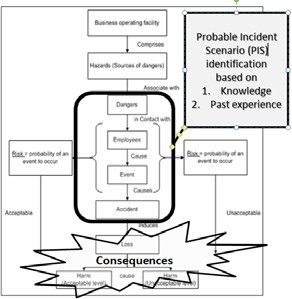
Figure 2: The RA methodology flowchart: (Left) Implementation presentation with the support of the tools presented and, (Right) the stage where the identification of Probable Incidents Scenarios takes place in order to specify the necessary measures
Figure 2 will not be analyzed as this is beyond the scope of this paper, but it is presented in order to depict the correlation of all the above tools presented (left) as well as to depict the fact that the key factor of any RAS is to identify and present to the maximum possible extent the Probable Incident Scenarios (PIS’s) in order for the Organization to be able to list the complete set of appropriate measures that reduce the risk to ALARP levels and therefore:
OMAINTEC Journal
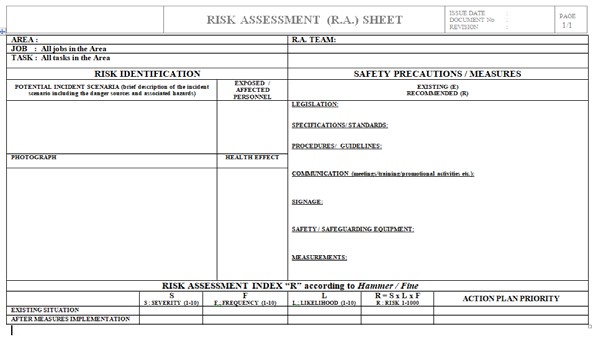
(Journal of Scientific Review)
evaluate the existing measures
recommend, if necessary, existing measures upgrade recommend additional measures
Practically, all the above information can easily be combined in one RAS sheet form (Figure 3) as developed by the author and being used for years now with absolute success in thousands of RAS’s.
Figure 3: An one-page RAS sheet form that contains all information based on the PIS’s identified by the Risk Assessor
In this sense, the list of PIS’s presented in Table 3 is quite important as we shall see in the second part of this paper.
The Risk Assessment Methodology in Maintenance Activities
The second part of this paper goes further to analyze the requirements of an effective RAS for maintenance activities. The Risk Assessors must never forget that the RAS end-users are the members of the Affected Parties. The RAS objective is to identify the PIS’s in order to specify the measures that the Affected Parties must use. Consequently, a RAS must be a tool that can be easily understood, implemented, improved and even updated by all levels of the Organization’s Affected Parties which in this case is the Maintenance Personnel.
This part analyzes the special nature of maintenance activities to conclude why the methodology presented in the first part above, although comprehensive, is quite insufficient. On the other hand, a very comprehensive RAS would be extremely voluminous thus making it hard to be further managed not only by maintenance personnel but by the H&S Risk Assessors or H&S Professionals themselves. So, this part presents a simplified RAS methodology for maintenance activities which is as analytical as possible but
OMAINTEC Journal
(Journal of Scientific Review)
also, easy to be compiled, used and updated by the Affected Parties.
At this point it must be noted that this methodology does not rely on theoretical data; the author’s consultancy team, comprising experienced scientists, has implemented this simplified methodology in the heavy industry with great success the driver being the fact that an Organization may be willing or legally imposed upon to conduct a comprehensive RAS, but the budget usually presents the most serious burden. So, this simplified approach not only provides a practically manageable methodology in practice but this means that the time savings on behalf of the Risk Assessor and the resulting financial savings on behalf of the Organization, leads to a win-win situation.
The Maintenance Activities special characteristics
Maintenance activities are characterized by a number of specificities linked mainly to (a) the maintenanceActivities and, (b) maintenance personnel mentality. More specifically:
Maintenance activities are characterized by:
Lack of housekeeping (disassembling, laying out tools, occupying floor space, handling liquids etc.) leading to high STF hazards, the most common incident cause in every activity
Mentally & physically demanding activities (manual handling, extreme caution etc.) leading to fatigue and high stress situations
Specialized knowhow (for managing electrical, hydraulic, pressurized etc. systems)
Task diversity & complexity (to manage risk combinations under insufficient work methods) leading to high-focus demand in turn leading to high stress levels and H&S rules violation due to insufficient training
Repeated tasks (especially when conducting preventive maintenance) leading to familiarization with danger the most common basic cause of accidents leading to trivial mistakes in case any situation deviates from normal
“Non-productive” work (time pressure to complete the required tasks) leading to stress, H&S rules violation and mistakes
Maintenance personnel:
Are required to move and work in all areas of the Organization even outside the premises (to purchase materials and/ or equipment or even to execute maintenance tasks e.g. in company vehicles)
Execute tasks in almost all installations & equipment
Bear the belief that since they are usually highly skilled, they possess the knowhow to execute their work safely
Maintenance activities are also exposed to a combination of risks that are:
Area-related since maintenance personnel are present in most areas (workstation risks, non-working area risks like confined spaces, roofs etc., outdoor areas, off-site areas)
Job/ task-related (for tasks that may be regular, but also may be non-regular, or very rare tasks requiring specialized knowhow)
OMAINTEC Journal
(Journal of Scientific Review)
Work-related (since they are exposed to all kinds of hazardous energy types like thermal, radiation, kinetic, noise as well as unsafe behaviors and psychosocial hazards due to stress)
Maintenance activities are usually not risk assessed as they are not part of the normal operation activities and in that sense are somewhat “invisible”. Moreover, and owing to the above, a RAS is quite a cumbersome task for H&S Risk Assessors that demands specialized knowhow, a lot of paperwork and meticulous approach making the deliverables difficult to produce, extremely time-consuming and, moreover, expensive, an issue that cannot be easily justified to the Organization’s Management that usually do not possess the knowledge or rather the expertise to understand or justify such a high cost.
Furthermore, as mentioned above and as it is going to be analyzed below, the RAS becomes unmanageable due to complexity and volume thus being rendered useless and, finally, inert.
Maintenance Activities in phases
Maintenance activities are only considered the ones that are related to the maintenance coreActivities at the machinery and equipment under the scope of work, but actually that is only around a portion of the job. Maintenance activities can be expanded into three phases:
Phase 1: Preparation Infrastructure works management Target group (machinery, equipment, building, installations etc.) Procedures, guidelines review
Hardware (tools, chemicals, PPE, LOTOTO, spare parts etc.) selection Maintenance area preparation (evacuation, traffic control, signage etc.) Maintenance target (machinery, equipment, installation, building etc.)
Phase 2: Execution “Core” maintenance works Procedures, guidelines implementation
Power supply management LOTOTO, Confined space entry Hardware use for repair Hand & power tools, Devices Repair, replacement of worn parts
Disassembly, reassembly Special tasks
Phase 3: Delivery Trial runs, commissioning, restoration Procedures, guidelines implementation
Hardware use
Commissioning (test/ trial runs)
Area & object restoration (housekeeping, waste management) Delivery to users
OMAINTEC Journal
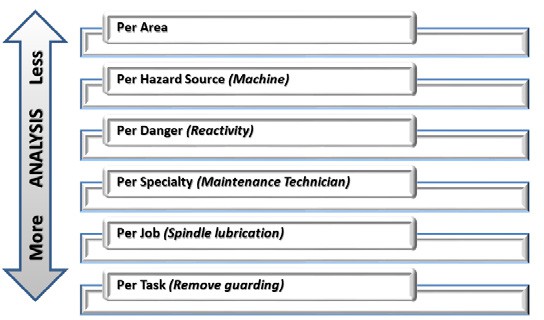
(Journal of Scientific Review)
The Maintenance Activities Risk Assessment Methodology Process
From the above analysis, any H&S Expert realizes that in order for an effective RAS to be conducted (namely identify all the PIS’s for all MAs conducted in an Organization) requires an analysis as detailed as possible. In Figure 4, the author presents the RAS Process stages depending on how detailed the risk analysis must be.
Figure 4: A representation of a RAS stages depending on how detailed the risk analysis is required to be depending on the operation under examination (in parenthesis examples related to MAs)
It is obvious that a RAS for MAs must be as detailed as possible in order to achieve identification of as many PIS’s as possible which in turn means that a RAS must comprise a JSA as anything less would be insufficient.
Maintenance Activities Job Safety Analysis (MAs JSA)
Before proceeding we must again cite some definitions that will be taken in to account in the MAs JSA: The expert knowledge required to effectively execute a duty comprises a specialty.
A set of duties necessary to effectively execute one or more jobs comprises a job position. A set of similar tasks comprise a job or duty.
The issue
OMAINTEC Journal
(Journal of Scientific Review)
Having conducted a number of RAS’s for MAs, the author and his team of H&S Expert Risk Assessors concluded that the following data are more or less accurate within a statistical error:
Average number of maintenance specialties/ Organization = 3
Average number of PIS’s/ maintenance specialty = 15 (out of total 17 see Table 3) Average number of jobs assigned to a maintenance specialty = 20
Average number of tasks in a job = 15
Hence, if we assume that we use one single RAS sheet (see Figure 3) to describe and manage the information of one PIS, the total number of RAS sheets required would result from the multiplication of the above numbers resulting in 13500 RAS sheets, this number being just an average. It is clear that a new approach is necessary.
The line of thinking
MAs RAS must specify preventive measures for all tasks performed; however, maintenance job tasks are more than 1000 in most industry operations. However, the PIS’s could be described in a limited number (maximum 17).
In most cases, some PIS’s are already identified during the previous RAS Stages (see Figure 4) and need not be repeated for each task. Therefore, one can develop a RAS per PIS which would include all applicable job tasks of each specialty excluding the scenarios already identified in the previous stages of more General RAS’s that have usually already being conducted. That means that the improved 10-step RAS approach depicted in Figure 1 must be adapted so that the PIS’s are allocated to each job task, while the rest of the process remains unaltered. Nevertheless, since most H&S Experts do not possess the knowhow to list the MAs and then further analyze them into jobs and each job into tasks as it is required, it is absolutely necessary that the Maintenance Department contributes in the early stages of the RAS process to provide this data.
Figure 5: The improved 10-step Risk Assessment Study approach that must be used for industrial and other high-risk operations adapted for MAs; the changes with respect to Figure 1 is noted in grey
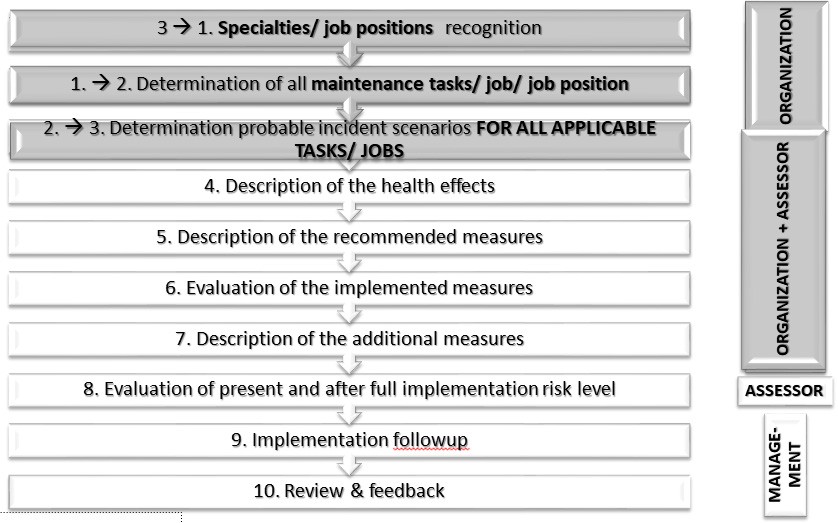
OMAINTEC Journal
(Journal of Scientific Review)
The simplified methodology to conduct a Maintenance Activities Job Safety Analysis (MAs JSA)
This new RAS methodology requires at first that the degree of involvement of the Organization is absolutely necessary in the first 3 steps during which the H&S Risk Assessor must guide Maintenance Personnel to provide him/ her with lists of the maintenance specialties e.g. electrician, machine shop mechanic, welder etc. and then provide for each specialty a list of jobs they perform and further on break down each of these jobs into tasks.
For example, an electrician may perform jobs like electrical motor testing, electrical panel thermographic inspections, lighting fixtures replacements, electrical equipment repairs etc. These jobs in big companies are usually described in the Job Description Sheets and could also be provided to the H&S Risk Assessor by the Human Resources Department, but they still have to be checked and verified by the Maintenance Organization (Manager or Supervisor).
If the Organization decides to conduct a full JSA, then again the Maintenance Organization must provide a full analysis of each of the jobs into a list of tasks taking into account all the maintenance job phases as described in paragraph 3.2 above.
For example, to execute a thermographic inspection job the electrician needs to prepare a program for the panel under consideration, review the H&S guidelines (since this inspection is conducted under full load and when the circuits are live), prepare the PPE that must be used (insulated gloves, safety glasses etc.), prepare the demarcation equipment (electrical hazard signs, cones etc.), evacuate the immediate
OMAINTEC Journal
(Journal of Scientific Review)
electrical panel area, open the panel door, remove the front electrical panel cover, apply full load, take the thermal imaging picture, replace the panel cover and so on.
Then, instead of examining each and every job or task to assign all PIS’s the following procedure is made by the H&S Risk Assessor:
They assess which of the PIS’s are applicable (for MAs this number is 15 on average/ job, see 4.1 above)
They record ONLY ONCE the PIS’s that are applicable for all jobs of the specialty; for example, if the MAs are executed in areas with noise, then the PIS “exposure to higher than the permissible noise levels” (number 16 in the PIS list of Table 3) is only recorded once for all jobs and tasks and need not be repeated. These PIS’s are linked to the Organization’s infrastructure and are probably included in the general Area RAS, so a simple reference or reproduction is sufficient and saves time. In any case, one or two RAS sheets are sufficient to cover these PIS’s.
Then, they record ONLY ONCE the PIS’s that are applicable for all MAs (jobs or tasks or both); for example if the job involves maintenance of a food filling line during which maintenance personnel walks on a wet floor, then the PIS “slipping at and falling exposure to higher than the permissible noise levels” (number 1 in the PIS list of Table 3) is only recorded once for all jobs and tasks and need not be repeated. In this case also, one or two RAS sheets are sufficient to cover these PIS’s.
Then, they assign all applicable tasks to each REMAINING PIS’s, since the above already analyzed PIS’s need not be repeated. In practice this step rarely results in more than 10-12 RAS sheets.
The overall result is a RAS document for each job that has an average of 15 RAS sheets and covers all tasks for each job, i.e. it comprises a JSA for the MAs under assessment.
The above RAS process analysis approach creates the need to change the general RAS sheet form presented in Figure 3 to include additional data for each maintenance job or task. More specifically, it is necessary to include fields where the Organization will list all the jobs per job position and/ or all the tasks per job for the detailed RA analysis. These RAS forms correspond to the fulfillment of the first two steps of the MAs RA process shown in Figure 5 and must be filled, as already mentioned, by the Maintenance Professionals (Director, Manager, Technician etc.) of the Organization. This form is presented in Figure 6.

Figure 6: The initial form the Maintenance Professionals must fill and deliver to the H&S Risk Assessor for the latter to initiate the MAs JSA
OMAINTEC Journal
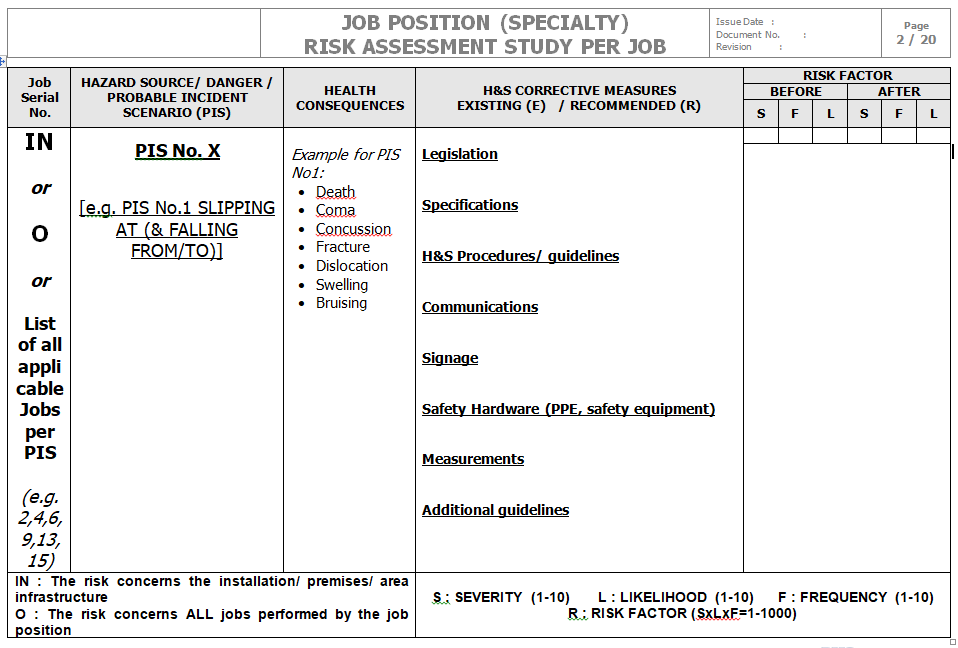
(Journal of Scientific Review)
The next step is to be able to present the RAS data in a manner as concise as possible without sacrificing the required detail, according to the procedure described above (steps 1-4). For this purpose the RAS form is slightly changed as depicted in Figure 7 below.
Figure 7: An one-page RAS sheet to conduct the MAs JSA
The H&S Risk Assessor needs to examine the list of jobs of the form depicted in Figure 5 and then examine the PIS’s applicable for the jobs listed and start allocating jobs to the PIS’s and not vice versa, as follows.
The not applicable PIS’s are excluded (e.g. replacing electrical fixtures may not involve exposure to biohazards i.e. PIS 11 on Table 3). From the remaining PIS’s:
If a PIS is caused by the Organization’s infrastructure (e.g. exposure to workplace noise due to the machinery operation in the production area during the MAs performed) then this is indicated as “IN” in the first column “Job Serial No.” and need not be analyzed further since it is already included in the more general versions of the RAS.
If a PIS is MAs-specific and concerns ALL the jobs of the job position i.e. jobs 1-20 in the list of form of Figure 6 (e.g. slipping due to a slippery floor in the production area) then this is indicated as “O” in the first column “Job Serial No.” and it is only analyzed once for the job position.
OMAINTEC Journal
(Journal of Scientific Review)
Then, to the remaining PIS’s the applicable jobs are assigned in the first column “Job Serial No.”; for example for the job of changing lighting fixtures, PIS No.5 from Table 3 “Falling from another level” is applicable only for the jobs of the list of Table 6 that involve the use of ladders, scaffolds, elevated platforms, scissor lifts etc. so in this column these serial numbers shall simultaneously be assigned (e.g. 2,4,6,9,13,15) and will not be repeated for each job or task, thus saving additional RAS sheets (in this example 1 RAS instead of 6 only for the PIS no.5 of falling from another level).
The volume reduction is further achieved if we consider the fact that:
infrastructure PIS’s (IN) could be mentioned in the MAs JSA but need not be further analyzed, but only referenced to the less analytical RAS
more than one descriptions of a specific PIS may be described in the more than one PIS’s may be analyzed in the RAS sheet of Figure 7
In Figure 8 that follows, one actual example is presented, extracted from a MAs JSA conducted for a heavy metal forming industry. All identification data were removed for obvious reasons.
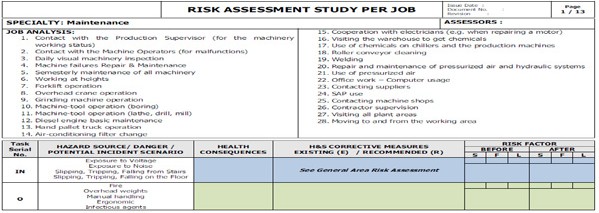
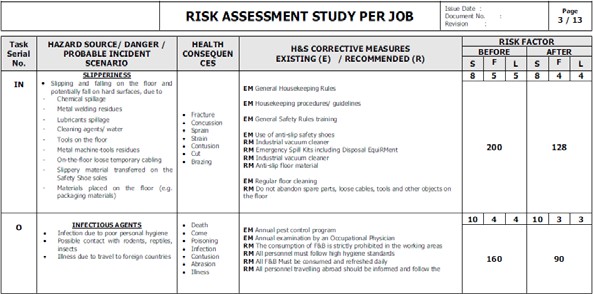
Figure 8: Example of a set of RAS sheets for MAs JSA
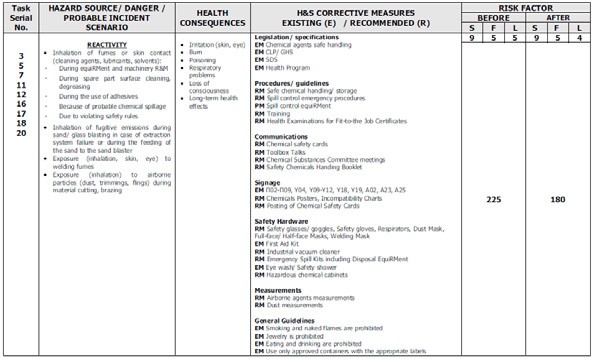
OMAINTEC Journal
(Journal of Scientific Review)
The updating process
The RAS JSA forms used in this MAs JSA are of general form and can thus be used for other activities as well. Moreover, their setup facilitates the updating process by either the H&S Risk Assessors as well as the Maintenance Professionals. This updating may be executed quite easily in 3 steps,
If a job/ task is added, removed, changed then one can:
- Change the job/ task list
- Add to/ remove from the first column the corresponding number of the task
- Update the data only in the applicable fields
- If a recommended measure is complied with then one can:
- Change the prefix from RM (recommended measure0 to EM (existing measure)
- Recalculate the risk factor under the column “AFTER”
Results
The results of this approach in order to conduct a Risk Assessment Study of Maintenance Activities as analytical as to result in a Job Safety Analysis as analytical as possible and put it in a manageable form easily to be updated, had impressive results.
The number of Risk Assessment Study Sheets to conduct a Job Safety Analysis for Maintenance Activities was reduced from the expected 13500 if the conventional methodology were used to only around 400 for heavy industries with mainly in-house maintenance and employing around 1000 employees.
The number of working hours allocated was reduced by 250-300 per Study resulting in substantial fee savings on behalf of the Organization but, on the other hand, making the H&S consultancy fee tendering
OMAINTEC Journal
(Journal of Scientific Review)
more competitive on behalf of the H&S Consultant.
After 3-4 years of implementation the Maintenance Personnel as well as the internal H&S Professionals seemed quite satisfied by the RAS completeness and manageability.
Conclusions
Maintenance activities are so complex that, in order for a Risk Assessment Study (RAS) to be complete and effective, it should be conducted per Task or Job meaning that only a Job Safety Analysis (JSA) is acceptable, which in turn demands excessive resources if conducted with the conventional methodologies.
The JSA methodology can be simplified if the safety expert takes into account that, instead of conducting a RAS per Task, they can instead conduct a RAS per Probable Incident Scenario excluding the ones already covered by more general versions of the RAS.
The presented methodology achieves all the above objectives not only in theory but also in practice, as it was tested in very demanding high-risk industrial environments
The achieved volume as well as time savings may reach 80% thus making the RAS/ JSA easier to conduct as well as more manageable by the Organization.
References
- J. Kosk-Bienko, M. Milczarek, “Maintenance and Occupational Safety and Health: A statistical picture”, European Risk Observatory Literature Review, pp. 42-45, (2010)
- K. Sweeny, “The Health & Safety Executive Statistics: Statistics 2009/10A”, The Health & Safety Executive, p. 17, (2010)
- G. Scroubelos, “Incidents in Maintenance: their links to the tasks special characteristics and proposed measures”, EU-OSHA Magazine, Issue 12, pp. 14-18, (2011)
- V. Moustakis, G. Scroubelos, “Methodological framework for conducting a risk assessment study”, Safety Science Monitor, Vol.13, Issue 2, Article2,(2009)
- M. Porthin, “Advanced case studies in risk management”, Helsinki University of Technology, Master’s Thesis,(2004)
- British Standards Institute, “BS OHSAS 18001:2007 – Occupational health & safety management systems – Requirements”, pp. 2-5, (2007)
- British Standards Institute, “ISO 31000 – Risk management – Principles and guidelines”, pp. 1-7, (2009)
- International Standards Organization, “ISO 45001:2018 – Occupational health & safety management systems – Requirements with guidance for use”, pp. 1-8, (2018)
- Commission of the European Communities, “Annotation for conducting a risk assessment“, p.13, (2000)
- European Parliament, “Directive on the control of major-accident hazards involving dangerous substances, amending and subsequently repealing Council Directive 96/82/EC”, Official Journal of the European Union, L197, p. 6, (2012)
OMAINTEC Journal

(Journal of Scientific Review)
Autonomous Unmanned Aerial Vehicles for Pump Station Predictive Maintenance Works
Mohammed Abdulaziz, Emad M. El-Said 1Simtran Product Development i.G., Eningen, Germany – 2Fayoum University, Fayoum, Egypt
The unmanned vehicles are used long time ago for many tasks to provide better performance and reduced cost and time. A well-known example is Diedi project, in which an unmanned vehicle was used to discover a confined space inside the Egyptian great pyramid. Since the 3rd industrial revolution the humans started to use the unmanned vehicles to carry out more tasks in behalf of them in order to minimize the cost and increase the quality of the performance.
Abdulaziz et al. [1] performed an experimental work to explain how the usage of unmanned aircrafts for performing the maintenance works in confined spaces reduce the time and cost. They used remotely controlled quadcopters to perform inspections. The paper discussed how the data could be implemented into an industry 4.0 system as well.
Preventive maintenance works of a centrifugal pump station in terms of pump vibration and temperature are running on cost and time. Many papers investigated a number of contactless measurements methods, which could be used for pumps.
One of many papers about contactless vibration measurement methods is that published by Nassif et al. [4]. They compared experimental results of the contactless vibration measurement data of a laser Doppler vibrometer – LDV with contact sensors. The LDV expressed a good performance in comparison to the contact vibration sensors.
The very recent work of Fernando Moreu and Mahmoud Taha from the University of New Mexico in July 2018 “Railroad Bridge Inspections for Maintenance and Replacement Prioritization Using Unmanned Aerial Vehicles (UAVs) with Laser Scanning Capabilities” is indicating a very similar idea to that used in the present paper. The experiments of them were more compacted as those of the present work.
Using the infrared photography for temperature measurement is common and has many applications in the industry and laboratory experiments. In comparison to other temperature measurement techniques, the infrared has a good ability to perform a precise measurement [5].
The present paper introduces and validates the idea of using remote sensing unit carried on an unmanned aircraft to perform the needed measurements as a part of preventive maintenance program of a centrifugal pump station. Loading such devices on the bottom of an AUAV was a challenge [see Figure 1].
Fig.1: Drone equipped with remote sensing unit [3]. P1

OMAINTEC Journal
(Journal of Scientific Review)
The main goal of this presented technique is to have a data, which are remotely sent and implemented into an industry 4.0 system to help the main control unit of the pump station to have a supported decision within short time and at high precision. A flow diagram of the inspection procedure is shown in figure 2.
In the following sections, more details about the experiment will be discussed and the results will be investigated in terms of time and cost.
![]()
Task
clarification
Drone
inspection
Data validation
and evaluation
Report with
analyzed data
Fig. 2: A flow diagram of the inspection procedure showing the role of remotely operated vehicles [1].
Experimental Investigation and Results
An AUAV (programmed quadcopter) was used to fly over a pump station, which has 10 pumps, to perform infrared imaging and vibration remote sensing. Two remote measurement devices were mounted on the bottom side of the drone, which are LDV and IR-camera. The drone was equipped by a wireless communication module to send data to the control system.
OMAINTEC Journal

(Journal of Scientific Review)
Figure 4 shows the layout of the pump station, which is considered as a test field. The station was selected at a water treatment plant in south Germany. It was selected to have exposed mechanical components, which are not covered by pipelines. The exposed components are easy to be captured by the remote sensing devices without big maneuvering effort. The goal of that is to make the inspection flight programming more simple and precise. The ten pumps are identical and has an overall reference vibration RMS value of 13 m/s2 measured by the supplier at the best efficiency point. The ambient temperature inside the pump roam was measured 31°C average. The measurements were done while all pumps were active.
Fig. 3: Thermal imaging as a temperature measurement technique for centrifugal pumps [6].
A personal computer was used to receive measurements data from the drone and perfumes the analysis. The analysis had been done using a software provided by the IR camera supplier and installed on the used PC.
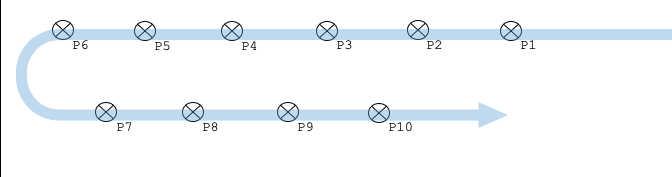
Fig. 5: Vibration results.
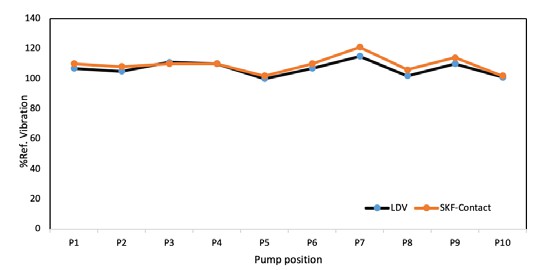
OMAINTEC Journal
(Journal of Scientific Review)
Fig. 4: The pump roam layout and the fly path.
For further validation of the results, a manual measurements had been done using contact sensors. The both results were compared in a further phase of experiment done after analysis. After many trails, a low altitude flight measurements had been considered for validation. The flowing figures show the results and a comparison with the classic measurement method. Furthermore a figure shows the time consumed for both methods is prepared for cost estimation, which will be discussed in the conclusions.
Figure 5 shows the measured RMS vibration values as a percent of the reference value. The figure shows a results comparison between the LDV and contact SKF measurement device. The points of the figure are shown to be pointwise per pump. Furthermore, figure 6 shows the comparison for the maximum measured temperature.
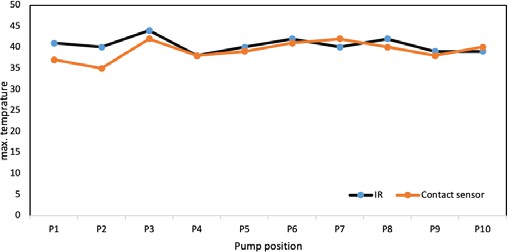
OMAINTEC Journal
(Journal of Scientific Review)
Fig. 6: Temperature results. Conclusions
The present paper introduce the idea that both vibration and temperature could be measured in efficient way by using contactless measurement devices mounted on an unmanned aircraft. A pump station consist of ten water centrifugal pumps was used a test field. The measured values were validated by a fair comparison with a classic method of measurements.
Both comparisons of vibration and temperature show a good agreement, which indicates that using such measurement method in the preventive maintenance may be efficient if used under the same conditions and application.
Moreover, the time consumed was reduced by 40% if compared by classic measurements method, in which the humans are playing the main role. The way, by which the data sent and analyzed, is an ideal way to be implemented in an Industry 4.0 system. The data are easy to be collected, sent and analyzed.
References
|
[1] |
M. Abdulaziz, E. Elsaid, “Automated Maintenance Team for Confined Spaces: Unmanned Aircraft”, OMAINTEC Conference 2017. |
|
[2] |
Drew Michel, “Remotely Operated Vehicles”, knowledge and skill guidelines for marine science and technology, volume 3. |
|
[3] |
https://www.polytec.com/eu/optical-systems (access 27.08.2018). |
|
[4] |
H. Nassif, M. Gindy, J. Davis, “Comparison of laser Doppler vibrometer with contact sensors for monitoring bridge deflection and vibration”, NDT & E International – Volume 38, Issue 3, April 2005, Pages 213-218. |
|
[5] |
P. Childs, J. Greenwood, C. Long, “Review of temperature measurement”, Review of Scientific Instruments 71, 2959 (2000). |
|
[6] |
http://a.fluke.com (access 27.08.2018). |
|
[7] |
http://onlinepubs.trb.org/onlinepubs/IDEA/FinalReports/Safety/Safety32.pdf (access 29.08.2018). |
OMAINTEC Journal

(Journal of Scientific Review)
Comparison between European and Asian Companies on Total Productive Maintenance Implementation
Siti Nabilah Misti* and Raja Muhamad Hafiz Raja Adzhar
Faculty of Engineering and Environment Northumbria University
Newcastle upon Tyne, United Kingdom
Lean manufacturing is usually regarded as a cost reduction mechanism. The goal of lean is to make organizations more competitive in the current market by maximising the Total Productive Maintenance (TPM) potential. This maximisation of TPM will make the organization’s efficiency increase and reduce operation costs. In 1971, the Japanese introduced TPM due to maintenance and support problems that occurred in the manufacturing environment. According to Swanson [1], the aggressive way to improve the function of the production equipment is by implementing TPM.
The elimination of losses and waste is the main target in lean manufacturing. In TPM, there are Six Big Losses which cause the efficiency loss in manufacturing. An organization can achieve their own strategic goals without sacrificing effectiveness if they produce exactly according to the demand and on time [2]. A TPM policy could help them achieve these results. The major features of TPM target maintenance activity, autonomous maintenance and the use of small cross-functional teams. The need for TPM has been customer driven, where improvements in equipment performance has become a necessity.
TPM is used in many companies but the percentage of companies who will benefit from TPM implementation is quite small. According to Davis [3], there are a number of reasons why a company fails to implement TPM such as failure to enforce lack of support from the management to the shop floor, lack of education and training, not serious in changing, and many more. Therefore, there is a need to investigate the cause of these unfortunate events. Through this research, improvements can be recommended to companies that are implementing TPM and planning to do so in the future.
This paper aims to investigate the issues of TPM implementation in the actual manufacturing industry. There are three main objectives which are:
To analyse current maintenance systems present and identify the shortcomings.
To compare the differences and similarities of the problems in their TPM implemen tation.
Propose a new solution in the implementation of TPM to eliminate the shortcomings and maximise their overall performance.
Development of TPM
TPM is one of many excellent practices which follow the Total Quality culture, and one aim is to boost competitiveness through adopting lean principles. Japan Institute
OMAINTEC Journal
(Journal of Scientific Review)
of Plant Maintenance (JIPM) defines TPM as a system to prevent any kind of loss and aims at building up a company that thoroughly pursues production systems improvement. Bamber [4] defined TPM by using two kinds of approach which are either described as the Western approach and the Japanese approach.
In the Western approach, the pioneer was Edward Wilmott, managing director of Wilmott Consulting Group. However, he only defines TPM in a way that is more likely to suit Western manufacturing although he agrees with the Japanese five point definition. He focuses on achieving the standard performance of the Overall Effectiveness of Equipment (OEE) with total participation company-wide. There is another person who adapts the TPM definition to the Western companies, Edward Hartman, president of the International TPM Institute Inc. He was recognised by Nakajima as father of TPM in the USA. Hartman [5], indicates that TPM that is implemented permanently will improve the OEE and this will succeed with the participation of the operators [4].
The definition of the Japanese approach to TPM was given by JIPM. This definition was given by the JIPM vice chairman, Seiichi Nakajima in 1988. He is regarded by a lot of TPM practitioners as the father of TPM [6]. Five points which were included in the definition of TPM are listed below:
It aims to use the equipment in manufacturing to its fullest potential or the most efficient way.
TPM system will be spread throughout the company with the use of improvement related maintenance, preventive maintenance and maintenance prevention.
Total participation from the entire maintenance department staff, equipment operators, and equipment designers are required.
TPM will totally involve every employee from the management department to shop floor.
Promote and apply PM based on autonomous work in small group activities.
There are eight pillars of TPM identified by Ahuja and Kamba [7]. By putting all these pillars in place, TPM will efficiently work and will definitely help any company to achieve their strategic objectives. These eight pillars of TPM are depicted in Figure
1. The implementation for each company will differ from each other as TPM is not defined as a solid fact to be followed but it is only as a guideline to companies. Different background and profile will determine on how TPM will be carried out in each company. Throughout many discussions in the western country, there is one thing that was mentioned over and over again, it is the participation of all employees and autonomous maintenance.
Figure 1: Eight Pillars Approach for TPM as suggested by JIPM [8].
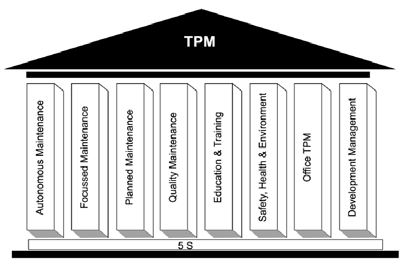
OMAINTEC Journal
(Journal of Scientific Review)
Computer Aided Maintenance Management (CAMM) is also one of the ways in implementing TPM. This method keeps check on the condition of the equipment in the production floor. Data gathered will be analysed and any equipment that needed to be focussed on in maintenance will be marked and planned maintenance can be scheduled afterwards. The area of equipment that have a high frequency of breakdowns will be focussed on and operator in the area can be given training to know the equipment better as to identify the signs of breakdowns or steps to prolong the life of the equipment [9-11].
In TPM, there are a set of known waste or losses which are easy to measure and have low impact on profit [12]. But, there are also losses that are hard to measure that will give quite an impact on profit. A number of losses were determined and they have been categorised into six categories (Six Big Losses) ranging from breakdowns, setup and adjustments, small stops, reduced speed, start-up rejects, and production rejects. The six losses were defined into 3 categories in TPM, which are Down Time Loss, Speed Loss, and Quality Loss [13]. If all these losses were monitored and corrected, the efficiency loss in manufacturing operation will be negated.
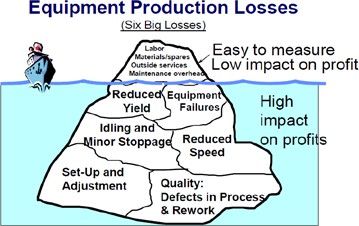
OMAINTEC Journal
(Journal of Scientific Review)
Figure 2: Six Big Losses [8].
Figure 2 shows different types of losses that will have a huge impact on the company profits. There is a flexibility to set a definition between a breakdown (Down Time Loss) and small stops (Speed Loss). However, breakdowns are more prone to things such as tooling failure, unplanned maintenance, general breakdowns, and equipment failure. Usually these breakdowns will take more time to be solved compared to small stops. It is critical to reduce or eliminate breakdown in improving OEE. Unplanned down time is hard to determine but it is crucial to know on how much time will it take in each breakdowns and it is also important to know what is the source or reason for the breakdown to happened in the first place. These data shall be charted and tabulated to apply the Root Cause Analysis, preferably starting with the most severe loss categories.
Hansen [14] stated that OEE was created in the 1960’s to determine the effectiveness of a manufacturing operation. It is a single figure that signifies the utilisation of a machine. OEE can be used to define the scope needed for improvement and the way to measure it. There can be no improvement if there is no measurement. Therefore, OEE measurement is commonly used as the Key Performance Indicator (KPI). This is in conjunction with lean manufacturing efforts to provide an indicator of success. A complex production problem can be turned into simple and intuitive presentation of information with the use of OEE. It helps systematically improve the process with easy-to-obtain measurements. The calculation for OEE is shown below:
OEE = Availability x Performance × Quality (1)
Where;
Availability = Operating Time / Planned Production Time (2) Performance = Actual Run Rate / Ideal Run Rate (3)
Quality = Good Pieces / Total Pieces (4)
Many previous studies were conducted in order to see if TPM implementation does make a change in companies. Some of the studies were successful and there are some of them do not achieve the maximum potential of a TPM should have. However, all of the researchers use different ways to portray their study on these companies. This is just because all of these companies have their own company background and profile, so they would implement TPM suited for their company best. Finally, according to these studies, success factors alongside with its implementation issues or difficulties can be identified. These identified cause and factors can be used in further research or improvements.
Based on the previous studies conducted by different scholar [4, 15-18], there were some issues and difficulties detected in TPM implementation. In reality, the number of companies that have successfully implemented TPM is quite small compared to
OMAINTEC Journal
(Journal of Scientific Review)
companies that fail to exploit all the benefits in TPM program [19]. Bakerjan stated that there are three major obstacles in TPM program which are failure to allow sufficient time for the evolution, lack of sufficient training, and lack of management support. Management support is very important in implementing TPM as the management team will carve the path on how TPM will be applied. Failure on realizing the true goal of TPM will make TPM implementation ineffective. Training is also important, as it will give all employees the skills and knowledge about TPM. This will make the autonomous maintenance activity easier. Bakerjan also commented that, time is an important aspect as company-wide changes should take quite some time and if it was done in a hurry, everything could fail.
There are a lot of benefits in implementing TPM as it is a hybrid in maintenance activities. Through TPM, employees’ skill can be upgraded and participation of all section will increase and this will boost efficiency. Plus, they will also gain and boost their teamwork within this company. Employees, especially operators will know better about the equipment and this will help to reduce the number of breakdowns and set up time in production.
Comparison of the TPM Implementation in the Asian and European company
TPM implementation was so well known as a lot of companies tried to utilise this step in order to improve their performance and efficiency. However, to optimise the utilisation of TPM is very subjective and every company need to find their own way of implementation. The failure to utilise the full potential of TPM can be seen in two case studies that were highlighted in order to compare their main issues and similarities in the implementation for future use in TPM implementation. The first company is Continental Sime Tyres which based in Asia, and the second one is a corrugated fibreboard manufacturing company which based in the United Kingdom.
Even though both companies used the TPM approach to eliminate losses and reduce cycle times, there is still room for continuous improvement because they have not achieved the maximum potential of TPM. In the case studies, the main problem was identified for both companies, in which for the Asian company, training and education was identified as the main root problem while the Europe based company was mainly caused by the lack of communication and teamwork. The different approach was identified by comparing the staffs and workers in both companies. The Asian company is profounder in using foreign worker in the production floor and this might be the problem why most of the workers were never given the chance for TPM training. These foreign workers are usually supplied by agents who put low requirements for people to apply for a job. On the other hand, European company usually uses local worker. However, the requirements for low skills worker such as operators are usually low and the people who work in this area are normally ignored for any training as they deemed to be a waste of time and money by the employer. The other similarities of TPM implementation problems in these case studies includes the lack of knowledge in project management skills, wide gap between the production and maintenance personnel, and both of the companies were not serious enough to adapt to the changes that was brought by TPM. These companies highlighted that there is a high possibility of losses in the production area due to problems like equipment breakdown or minor stoppages while operating. Duplicated
OMAINTEC Journal
(Journal of Scientific Review)
documents of maintenance work such as request sheets, log books, and time sheets also contribute to the problem in implementing TPM. These duplicated documents will make the purpose of having written report useless as it will not reflect the true condition of the machines that needed to be focussed on.
Although there are more problems in these companies, these identified problems were the main things that need to be resolved by the company in order to increase their efficiency in production, and hence achieve the TPM goals and objectives. These problems that occurred have also been compared with ten reasons on TPM failure by Davis theory to determine if they are the same or different to one another
[3] in Table 1.
There are two main differences in the table between these two companies. The first difference is about the program conducted is too high level which run by managers for managers. As for the Asian company, this problem is true where the operators were left in the dark about the TPM program. The European company does not have the same problem as the worker knew about the program well enough but communication problem was in the way of the TPM program success. Manager just gives order and the staffs that should carry out the order were left out with no supervision, hence, resulted in duplicated reports in report sheets, and logbook. The second difference is about lack of education and training. The Asian company did not give sufficient education and training to the staffs especially to the production floor team. One of the known reason is that a lot of the operator in the company are foreign worker and the company might have concluded that it will be a waste of resource to support the operators for training as they might ignore the TPM program or change their job at the end of the day. As for the European company, even though they have been given the education and training, the barrier between the management and production might be too strong as they still fail to reach the full potential of TPM program.
Table 1: Comparison of TPM issues in both companies with Davis theory.
|
SIMILARITIES OF TPM FAILURE |
Asian Company |
European Company |
||
|
YES |
NO |
YES |
NO |
|
|
Not serious in changing program |
||||
|
Inexperienced facilitators or trainers |
||||
|
Program conducted is too high level (run by managers for (managers |
||||
|
Lack of relationship and structure |
||||
|
Shop floor was left out of the program and/or not man- aged |
||||
|
Lack of education and training |
||||
OMAINTEC Journal
(Journal of Scientific Review)
|
Program is run by engineering section and production section see this as though it does not concern them |
||||
|
Use the Japanese way on applying TPM (through Japa- (nese publication |
||||
|
TPM teams lack the necessary mix of skills and experi- ence |
||||
|
Poor structure and organisation in supporting TPM and its activities |
Results and Discussions
Equipment breakdown was stated first because from the data gathered, there is a certain machine that keeps on getting faulty for the Asian company and this might have cost them dearly as the corrective maintenance will cost about three times more than preventive maintenance [20]. Data gathered shows that breakdowns occurred 436 times for all machines or equal to 202.45 hours of breakdown and these findings were taken only from January. If this situation persists throughout the year, the accumulated breakdown time will be excessive. High demand in production was also identified as the reason for the Asian company on why the maintenance team cannot cope with additional work load imposed by TPM as there are a lot of machines to maintain with a small timeframe. There were not enough personnel to do the service on each machine and from the interview conducted; there was no utilisation of previous machine breakdown data to determine which machine should be focussed on.

Figure 3: Available Time for Maintenance Staff.
From the interview and questionnaire conducted, staff claimed that they do not have enough time to enforce preventive maintenance on all the machines in time and urges the management to add more staff in order to do all the work within the specific schedule. The personnel time was originally measured using their time in and out, inevitably showing fully eight hours of each work shift. However, this measurement cannot be used as it assumes they had utilised their time to carry out maintenance work. From the calculations, manpower was only utilised around 30% to 35% of available time. This calculation was made using on the time requested on attending a machine breakdown. Figure 3 shows, the maintenance team should have around 65% of free time to carry out the additional proactive maintenance.
OMAINTEC Journal
(Journal of Scientific Review)
Basically, the work schedule was made based on staff availability and the schedule should have included buffer time for any unexpected things. So, they should have done all the servicing in time without any problems. In this case, there is no need for the additional staff and the claim by the maintenance team was rejected. What actually happened here most probably was the staff were suspected to have not been utilising their time in their work hours. To prevent this from happening, a written report is mandatory that checks their work on actual basis and the target for each staff must be set. Therefore, they will have a target to achieve for a period of time and failure to do that will have to be explained thoroughly to the person in charge. The European company deals with duplicated documents of log books, requests sheet, and time sheets which will create problems to map out the frequency of breakdowns. This action of duplication has wasted the effort and time which kills the purpose of having written reports on any incidents on the equipment. The data gathered will be useless in the CAMM as reports on maintenance do not reflect the true situation of the machines. This uncertainty in determining the real condition and status of the equipment may contribute to more breakdowns that may lead to costly reactive maintenance steps. Unplanned down time is hard to determine but it is crucial to know how much time it will take for each breakdown and it is also important to know what is the source or reason for the breakdown to happen in the first place. Breakdown data should be charted and tabulated to apply the Root Cause Analysis, preferably starting with the most severe loss categories. Negligence of this practice will cause random service to the equipment. As a result, some of the equipment will be serviced in a hurry to catch up with the schedule.
The European company’s case study also stated that communication and teamwork is the problem in implementing TPM. Barrier between the management and production team might have been too thick where any orders or efforts in TPM implementation were ignored or being done without real sense of purpose. This might have led the company to just duplicate the Japanese TPM implementation without considering the real problems of the company.
Moreover, lack of drive from the management in order to enforce TPM is one of the factors of failure in this company’s implementation. As a result of that, the production floor, maintenance team, and operators will feel that they are not obliged to do anything at all in enforcing TPM. Autonomous Maintenance (AM) is also very important and if this practice is left out, TPM will probably fail. AM is an activity where everyone participates in improving and maintaining the equipment’s reliability and efficiency. The main problem in this case is that there is lack of training available for the workers or the level of participation is too low.
From the analysis done, there are some key pointers that were discovered. The recurrence problems are such as equipment breakdowns, lack of connection between floors, and too uptight with the production demands that drives the negligence of proper maintenance practice. The outstanding number of breakdowns shows that there is space for the OEE to be improved for both companies to achieve a world class OEE which is at 85%. With the current breakdown frequency, real reports on the
OMAINTEC Journal
(Journal of Scientific Review)
documents needed to be analysed is also very important in order to plan for future maintenance program.
The communication between the managerial department and production has been poor that it drives the company towards average level of success whereas the company actually can achieve greatness by implementing TPM. The other problem that was discovered was more the attitude of the staff towards TPM implementation. Some of the staff that were unaware of the company aim and some of them did not care about it. They just care on punching into work and punching out, day after day as a work routine. Training was given to the staff but they seem to have a lack of awareness in implementing TPM in their line of work. However, to make all the staff to participate in this company will take some time but it is worth a try as it will boost the efficiency of the operation in the company.
All of these identified problems are very similar to those previous studies that were conducted throughout the years by many researchers. Some of the problems are not serious in changing, lack of relationship and structure, lack of education and training, poor structure and organisation in supporting TPM and its activities, and no motivation in the production section. With the elimination of the undesirable elements within the company, there should be no problem for success in the company by implementing TPM and this fact has been proven by previous case studies.
Future Improvements
There are some critical success factors in implementing TPM. First of all, the TPM pillars should be implemented depending on each company’s demands, operation, and situation. Therefore, it will probably not be the same in every company that uses TPM in their company. The objectives of implementing TPM must also be made clear in order to set a target for the company. AM is very important as it was known as the backbone of TPM. This program during implementation also had to be carefully monitored and managed to get the best out of it. The right mix of team must be deployed to ensure that waste can be eliminated, and hence ensure the smoothness of the operation. Documents that were filed must also be monitored as to prevent any duplication. For example, a weekly review on reports might be a good idea to identify if there are any fake reports or uncompleted forms.
Work related training must be provided to the workers and especially for the permanent staff. This is to enhance their knowledge and more importantly is to create awareness of AM and basically about TPM. With knowledge only, without awareness will get them nowhere and this will waste all of the efforts in giving them training. Simple work that was usually performed by the maintenance team on production floor should be in a training scheme for production floor personnel. This way, maintenance can always focus on preventive maintenance hence give them time to service the equipment thoroughly. This responsibility transfer from Maintenance to Production will form a partnership and enforce the AM. This step can also be widening to the management and might be able to break the barrier of communication and improve the teamwork. Another thing that was realised is that there is a connection between the TPM pillars
OMAINTEC Journal
(Journal of Scientific Review)
and OEE. Basically, in order to succeed in TPM implementation, the eight TPM pillars that were mentioned in the literature review should be in the right place and one of the ways to measure the effectiveness is by OEE. However, through this project finding, focusing only the three main pillars in TPM can improve the OEE. This is because OEE was predominantly influenced by the three pillars and the elimination of the Six Big Losses.
The three main pillars are, Planned Maintenance (PM), Quality Maintenance (QM), and Training and Education (T&E). Of all these three pillars, T&E is the most important one as this practice will give the knowledge and motivation to the staff on how to execute the TPM program correctly. With the right training program, many problems which cause TPM failure will be solved. Lack of the necessary knowledge, motivation, and skills are found to be the root problem in TPM. If this problem can be solved, TPM can be implemented smoothly. This relationship can be seen in Figure 4 below.
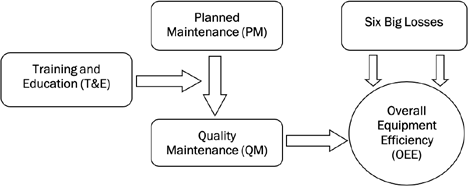
Figure 4: TPM’s 3 Predominant Pillars and Their Effects on the OEE.
Conclusion
The current maintenance in the Asian company did not utilise the use of TPM fully as they still practice reactive maintenance. TPM requires the practice of proactive maintenance or known as Planned Maintenance (PM) in TPM pillar. This objective also requested the identification of the shortcomings in the current implementation. The identified problems in the company are equipment breakdown, lack of AM practice, high volume of production, lack of training and education, and still practising the reactive maintenance instead of preventive maintenance. The European company on the other hand, have failed in implementing TPM mainly because of the weak communication and teamwork in their company. Because of this, the staffs would not have the required drive and motivation to implement TPM to the highest potential. However, this problem can also be solved by training and education.
OMAINTEC Journal
(Journal of Scientific Review)
Proposals on how to solve and eliminate the shortcomings were also given to the respective company. The problems were classified into five groups consisting of PM, QM, T&E, AM, and Safety, Health and Environment. In each group, a proposal or suggestion was included for each problem. As a solution, the company should make all of the proposals and suggestions as a reference and assimilate it to their company needs.
In this paper, lack of training and education was recognised as the root cause of all the shortcomings. The importance of training was slightly neglected by the company and if the right training scheme was carried out, the result will be better in the coming years of TPM implementation. The mix of three TPM pillars, which are T&E, PM, and QM will result in the increment of OEE. This project has achieved all of the stated goals and successfully provides the company with a number of suggestions. If all these research points were taken and used as a guideline or target, this company should be able to improve their overall performance.
References:
- L. Swanson, (2001). “Linking maintenance strategies to performance,” International journal of production economics, vol. 70, pp. 237-244.
- T. Cheng, S. Podolsky, and P. Jarvis, (1996). Just-in-time manufacturing: An introduction: Springer Science & Business Media.
- R. Davis, (1996). “Making TPM a part of factory life,” Works management, vol. 49, pp. 16-17.
- C. J. Bamber, J. M. Sharp, and M. Hides, (1999). “Factors affecting successful implementation of total productive maintenance: a UK manufacturing case study perspective,” Journal of Quality in Maintenance Engineering, vol. 5, pp. 162-181.
- H. Edward and P. Hartmann, (1992). “Successfully Installing TPM in a Non-Japanese Plant,” ed: TPM Press, Pittsburgh, 1992.
- S. Nakajima, (1988). “Introduction to TPM: total productive maintenance,” Productivity Press, Inc, P. O. Box 3007, Cambridge, Massachusetts 02140, USA, 1988. 129.
- I. P. S. Ahuja and J. S. Khamba, (2008). “Total productive maintenance: literature review and directions,” International Journal of Quality & Reliability Management, vol. 25, pp. 709-756.
- Asian Composites Manufacturing Sdn. Bhd., (2011). “TPM pitch for certification class,” ed. Kedah, Malaysia ACM Sdn Bhd, 2011.
- R. Jones, (1994). “Computer-aided maintenance management systems,” Computing & Control Engineering Journal, vol. 5, pp. 189-192.
- P. Y. Tu, R. Yam, P. Tse, and A. Sun, (2001). “An integrated maintenance management system for an advanced manufacturing company,” The International Journal of Advanced Manufacturing Technology, vol. 17, pp. 692- 703.
- F. Lee Cooke, (2003). “Plant maintenance strategy: evidence from four British manufacturing firms,” Journal of Quality in Maintenance Engineering, vol. 9, pp. 239-249.
- R. S. Russell and B. W. Taylor-Iii, (2008). Operations management along the supply chain: John Wiley & Sons.
- Vorne Industries Inc., (2011). “Six Big Losses,” ed, 2011.
- R. Hansen, (2001). Overall equipment effectiveness: Industrial Press.
- F. Ireland and B. G. Dale, (2001). “A study of total productive maintenance implementation,” Journal of Quality in Maintenance Engineering, vol. 7, pp. 183-192.
- F. Chan, H. Lau, R. Ip, H. Chan, and S. Kong, (2005). “Implementation of total productive maintenance: A case study,” International Journal of Production Economics, vol. 95, pp. 71-94.
- M. C. Eti, S. Ogaji, and S. Probert, (2004). “Implementing total productive maintenance in Nigerian manufacturing industries,” Applied energy, vol. 79, pp. 385-401.
- T. Friedli, M. Goetzfried, and P. Basu, (2010). “Analysis of the implementation of total productive maintenance, total quality management, and just-in-time in pharmaceutical manufacturing,” Journal of Pharmaceutical Innovation, vol. 5, pp. 181-192.
- R. Bakerjan, (1994). “Continuous improvement,” Tool and Manufacturing Engineers Handbook, vol. 7.
- R. K. Mobley, (2002). An introduction to predictive maintenance: Butterworth-Heinemann.
OMAINTEC Journal

(Journal of Scientific Review)
DEVELOPMENT OF REMOTE MAINTENANCE CENTER FOR SUBSTATION AUTOMATION SYSTEM
Author: Abdullah A. Al- Jahil,
National Grid, Saudi Arabia,
This white paper is intended to provide all users with a practical selection guide and strategic plan of developing remote maintenance center for substation automation systems. By taking National Grid Saudi Arabia as a case study to demonstrate its experience in the automation environment and approach to building remote maintenance center. This paper will be also cover the technical aspects according to the standards. It will focus on the existing advantages, and the remaining obstacles that are likely to occur with comprehensive guidelines of recommendations and action plans. Nevertheless, utilities and energy sector providers still face concerns with high capital and operational costs in their business. So, the paper will consider estimating expected capital fund for this investment and the saving return in operational expenses by providing real statistics from fields which can support decision maker to choose which option is best fits for their business style.
About National Grid Saudi Arabia
|
NG ASSETS |
TOTAL |
|
SUBS SUBSTATIONS ( 380 KV – 110 KV ) |
1010 |
|
PEAK LOAD (GW) |
62.260 |
|
SUBSTATION AUTOMATION SYSTEMS (SAS) |
572 |
|
FIBER OPTICS CABLES (KM) |
52.395 |
|
WIDE AREA NETWORK (CORE) |
51 |
|
WIDE AREA NETWORK (CE) |
761 |
National Grid SA (NG) is a power utility responsible for the transmission of electricity across the Kingdom of Saudi Arabia (KSA). NG uses transmission voltages of 380KV, 230KV, 115KV, and 110KV and has more than 1010 substations, transformers, kilometers of transmission lines, and over 52,000 kilometers of fiber optic cables. NG faces many of Saudi Arabia’s specific electricity sector challenges that require migration actions to meet the unbundling of the sector, peak electricity demand and quality of service. Power utility networks have always been inherently different from traditional corporate networks. The bulk of their infrastructure is dedicated to communicate with industrial equipment using various SCADA, SAS and smart grid protocols.
Table 1: NG assets [3] Smart Grid Envision By Abdulaziz A. Al-Sultan (Nov 2013)
In 2010, NG adopted SAS in their substations as a remote digital control system by employing the international IEC 61850 standard, which dominates the integration of all field applications. The SAS is a digital control system that is efficient, reliable, resilient and responsive. A real-time monitoring and control system has complex interlocking and sequence control requirements. The SAS is Ethernet-based and connected to one or several energy management systems by using serial or Ethernet protocols such as IEC 101 and IEC 104 through a complex cloud of a telecommunication network.

OMAINTEC Journal
(Journal of Scientific Review)
Substation automation system (SAS).
Remote maintenance center
Substation Automation systems are widely used for the purpose of control, protection, monitoring, communication etc. in substations that are in long distant locations. This often leads to problems when needing to diagnose, investigate and solve errors in the event of a fault. Complete remote support and monitoring of the system process is now possible. Thanks to developments of the technology, Remote maintenance describes remote access to automation system for fault diagnostics or for all software maintenance and administration purposes.
Remote control center
Energy management system (EMS) is widely used to display all substation parameters in real-time. It describes the remote monitoring and controlling of physically separate system parts by

OMAINTEC Journal
(Journal of Scientific Review)
means of data transmission. Measured values and control commands are transmitted over long distances and visualized, processed, and stored in a control center. The required information of circuit breaker statues , for example, Figure2: Sample of Remote control Center can be archived centrally for many years. Data can be transmitted securely over wide area networks (WAN), with discrete digital and analog signals. Recently there has been a clear move away from serial transmission paths toward IP-based communication.
Differences between remote control center and remote maintenance center.
In industrial communication, there is a vast difference between remote control and remote maintenance, even when using identical technology. This often leads to confusion when it comes to selecting the right communication media. The particular features of the different applications are therefore described below.
|
Control center |
Maintenance center |
|
|
Function |
Controlling / |
Administrating and |
|
monitoring the |
maintaining the |
|
|
power network |
Automation system |
|
|
Communication media |
Serial, Ethernet, |
Ethernet |
|
Radio |
||
|
Operator |
Power Dispatcher |
SCADA Engineer |
|
Objective |
power Control & fast restoration |
System administration & recovery control |
Table 2: Differences between Remote control center and Remote maintenance center.
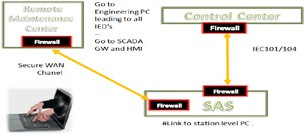
Figure 3: Automation system communication with Remote control center and Remote maintenance center. Need and importance for remote maintenance center
OMAINTEC Journal
(Journal of Scientific Review)
Responding to the emergency situations
In case of system failure. System engineer needs to go to substation , to solve the fault and restore the system to be in service and available for power dispatchers in short time. Any delay might happen of recovering the system , it may cause a negative consequences or real damages to the network due to unavailability of the information in control center. This delay can happen due to many reasons for instance traffic jams in big cities and far or isolated substation locations which make reaching substations quickly very challenging or others.
Increasing in operational expenses
By managing the automation systems in wide – coverage areas locally and manually the cost of maintenance will increases dramatically due to traveling expenses, time required for system restoration, needed number of employees and required tools such as cars and others. The chart below describes the National Grid SA master plan for Smart Grid transition.
Conventional Systems (RTU, DSM, SOE, WS and others)
Automation Systems
( GTW, SRV, EWS, SWITCHES, BCU, IED)
New Technologies
( Digital Substation, Smart grid initiatives )
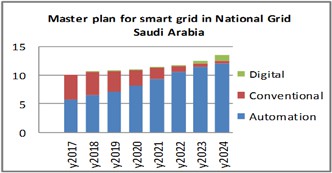
Chart 1: Installation of SCADA systems in Transmission Substation from (2017 to 2025).
Chart trend analysis ( 2017-2025)
Automation System (Statues of use: Sharply increasing)
The use of SAS in National Grid SA’s substation will keep increasing to be 75% from the total number of substation, which may reach 1000 out of 1200 Substation.
Conventional SCADA system (Statues of use: decreasing)
The use of Conventional SCADA system in National Grid SA’s substation will keep decreasing to be 19% from the total number of substation, which may reach 250 out of 1200 Substation.
|
NG SAS Design components |
Total # In Ave |
|
Computers |
6 |
|
Managed Network Switch |
25 |
|
Printer |
3 |
|
Bay Control Unit |
20 |
|
IED’s |
100 |
|
Type of Users |
12 |
|
Protocols |
5 |
|
Applications |
50 |
Today’s industrial product show a strong increase in functionalities and complexity. Maintenance engineer faces huge difficulties of mastering all different aspect in technical part. Dealing with emergencies situation under time pressure, criticality and sensitivity make it much worse. Think of Automation System, which is a set of protections, automation, data networks and cyber security. The combination of which makes it much more difficult for quickly identifying, isolating, diagnosing, and repairing any faults. The SAS is set of IED’s (protective relays, bay controls, etc), computers and network devices from several manufacturers, all connected via network redundant protocols as PRP and HSR. Other communication protocol include IEC 61850, T101, T104, SNMP and ANTP.
OMAINTEC Journal
(Journal of Scientific Review)
Digital Substation system ( statues of use : slowly increasing)
The installation of Digital system in National Grid SA’s substation will slowly increase to be about 10-20 out of 1200 Substation. Based on National Grid SA master plan for smart grid transition and the chart trend analysis, National grid will rely on the automation system as controlling and monitoring systems in its substation. This move was decided to get advantage from the technology by utilizing the features offers by automation system. The main concern ware enhancing the efficiency and reliability and decreasing the capital and operational cost.
3.3 Complexity of technology in various fields
Table 2: NG SAS average # of components
Basic physical requirements for Remote Maintenance Center:
-
- Maintenance Workstations
Minimum System requirements for effectively running the maintenance work station. The hard disk space grows overtime based on the stored data. More RAM space and high end processors are required depending on the Support Load and simultaneous access load. Industrial PC’s with all software of :HMI, BCU, SWITHES, GTW, SRV,IED’s AND Other tools need to be installed and licensed.
OMAINTEC Journal
(Journal of Scientific Review)
Secure Platform
International industrial cyber security standards define specific security standards based on the level of security needed as well as system criticality and locations . Securing the system from any access without authorization is always a need and big concern. physical access through biometrics, card readers, as well as padlocked Only authorized and authenticate engineers are allowed to access the remote maintenance center and systems work station.
Wide Area Network
WAN is recommended in applications where data from IP devices is transmitted. WAN describes an Ethernet network and supports the TCP/IP modules. For Automation remote access the activation of IEC 104 is required for application that used by a large number of devices. Particularly suitable for monitoring, operation, and data acquisition as it can be easily integrated into OT networks.
The associated challenges include:
Cyber security threats and strict polices for remote connections. Communications failure.
Lack of experts and qualified engineers to run and operate the remote center due to diversity of systems, functions, designs, architectures and vendors.
Organization culture and change resistance to use new concept of technology by using Ethernet communication protocol IEC104.
Project budget and capital funds.
Absence of real model and few cases with remote maintenance centers exist in utilities worldwide. National grid Action plan and guide line for implementation.
Global Improvement of Cyber Security measure at National Grid SA Industrial Control System.
The need and importance for control system security in utilities is great, The impact of a possible power network failure on the Kingdom of Saudi Arabia and on the reputation of NG made NG take responsibility for power network security by taking action for massive improvement program to make the power network more reliable and more secure. They reflect international standards and common best practices. And set of initiatives including master plan have been identified by NG to address the relevant and critical areas of improvement with different levels of priority and complexity. The security heat map for SAS below highlights the domains with number of areas of improvement to include suggested mitigation strategies in each vulnerability category. However, some of these actions have been already implemented in the field.
OMAINTEC Journal
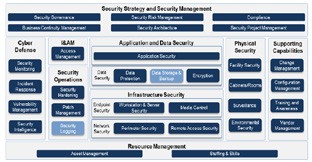
(Journal of Scientific Review)
Figure 3: Heat- Map for cyber security improvement
Enhancement of Physical and environmental access: This includes physical access through biometrics, card readers, as well as padlocked of the automation panels and server panels.
Monitoring: This includes systematic logging and SAS event alarming, and auditing, leading to the ability to track different SAs security issues and particularly allowing for traceability of access and actions. It also includes centralized monitoring of network devices and server health.
Improvement of asset management: This includes reinforcement of the asset management and systematic inventory list applications, and prompt recovery from an incident by having backup and restoration policies in place. SAS asset life is prolonged by clearly defining the maintenance strategy, including the adoption of a patch management process.
Improvement of NG processes: This includes structuring incidence response team processes and responsibilities among NG and its stakeholders in the case of cyber-attack, as well as a large deployment of cyber security, and comprehensive trainings to ensure awareness among employees of NG and its stakeholders.
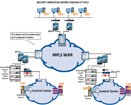
Centralized cyber security operations center: This can be used to manage all NG events to control, monitor and have the ability to better react and defend in the case of an attack. In particular, this SOC should be able also to perform some preventive maintenance and fine tune emergency plans, release reports, and deliver additional basic security services such as security infrastructure management, security intelligence, penetration testing, as well as advanced services like security analytics and cyber intelligence.
Figure 4: Sample of Security Operation Center SOC
Firewall upgrade: Upgrading to the next-generation firewall technology, which can provide more complex security configuration and management.
OMAINTEC Journal
(Journal of Scientific Review)
Forming regional and local maintenance teams.
In case of communication failure or hardware problem, the operator of remote maintenance center will not be able to access the system. That’s why there is a need for regional and local team across kingdom wide. SAS engineer needs to go to substation to solve the fault and restore the system in short time. The number of team member should not be large, it depends on two factors 1)number of systems and the size of geographical coverage area.
Intensive Development Program for engineers
National grid SA has started an intensive knowledge transfer program with all SAS vendors to develop its own SAS engineers/technician to be Experts, qualified enough and professionally certified. They will know how to master the automation system and maintain full administration of SAS. Those expert will be the key of success to run the remote maintenance center and provide the technical support for all maintenance engineers.
Pilot and experimental project
A conduction of pilot project in national grid SA premises is taking place these days to build virtual remote maintenance center by using Ethernet communication protocol. Three automation systems from different locations and similar SAS vendors will be connected to this center as first phase and all cyber security policy and recommendation will be applied. A weekly report will be internally generated to share the finding and output with all relevant divisions. The primary objective of this pilot project is to ensure that the risk from this transition is under control, determine the requirement of this installation and evaluate the use of remote access technology.
Budgeting
10 years ago, National grid SA. developed its own vision of smart grid transition and it made a huge investment on system upgrade. It included global upgrading program toward its own infrastructure, industrial control systems, and cyber security, which enhanced the capabilities and raised the possibilities to implement new systems and latest technologies. For these reasons, the cost of remote maintenance center installation will be a small additional phase of investment because the network readiness and strong base of foundation.
Fostering Collaboration with stakeholders
NG was aware that this transition could not be achieved by themselves alone. Collaboration between all vendors and national grid is a must. The best designs come from this collaboration by considering the National grid needs/ requirements and vendors capabilities. Number of meetings and workshops conducted to discuss the project and set the framework.
Estimated Return on investment (ROI)
The enormous benefits from Installing remote center, including cost savings, knowledge building and network reliability, which can be accomplished remotely as the following:
OMAINTEC Journal
(Journal of Scientific Review)
Tangible benefits
Operation technology system projects ROI should be based on tangible (or hard) benefits. Examples of tangible OT benefits (project savings / income) include:
60% reduction of travel expenses, remote support replacing on-site support, technician does not have to be on site or travel long distances in order to return the system to operation mode. downtimes are also reduced.
70% time saved eg increased productivity and reduction in time to complete tasks Time saved eg from reduced length /number of SAS can be served at same time. Time saved from reduced numbers of errors
Time saved from improving system reliability and having less maintenance or fewer problems to resolve Time saved with improved software vendor support eg quicker responses, faster fixes
Reduced cost& time of System extension and retrofit projects. 50% fewer number of maintenance labor.
Intangible benefits
Intangible (or soft or non-financial) benefits should not be included within ROI calculations. Whilst they are often as important as tangible benefits, they are very difficult to financially quantify. Instead
intangible benefits should be fully explained within the business case and where possible details given of any quantification or measurement. Examples of intangible OT benefits include:
Increased internal customer satisfaction (control, protection..) Ability to offer improved remote service and support
Improved / automated business processes that the new system supports and enables Faster and more accurate information.
Improved analytical solutions.
Better controls to improve data input accuracy.
Improved software vendor support and service, improved communications, better knowledge of software and system set up.
Ability to centralize Data archiving.
Ability for Cyber security control and network management Better for risk management and disaster recovery.
|
Locally |
Remotely |
|
|
Operational cost |
Very high |
60% reduced |
|
Capital cost |
Very high |
65% reduced |
|
Technical Experience |
Fair |
High |
|
Operational efficiency |
Good |
Excellent |
|
Policy &Standardization |
Good |
Excellent |
|
Strategic project management |
Difficult |
Excellent tool |
|
Smart grid & initiative |
Fair |
Strong base for SG |
|
Cyber security control |
Good |
Good |
|
Risk management |
Good |
Good |
CONCLUSION
OMAINTEC Journal
(Journal of Scientific Review)
Table 3: compression between local and remote SAS maintenance
National Grid SA has set a global plan for smart Grid transition program. This program started years ago by collaborating with stakeholders in different domains, and then conducting several pilot projects to evaluate these experiments and determine the requirements for every phase in the projects. Next, by analyzing the output of the experiments and findings, corresponding recommendations are applied for the development, which are based on various international standards and recommended best practices, and are used as a basis for enhancing the administration of Substation Automation systems. All can use the guideline to develop the remote maintenance center characteristics of current and future products. NG has the motivation and determination to keep the circle of collaboration, evaluation, modification and implementation of smart grid transition. They acknowledge the fact that that circle played a critical role toward achieving their main objectives, and bringing ensures of business continuity.
References
Periodicals:
- IEC62351
- National Grid SA Smart Grid Envision (Nov 2013) By Abdulaziz A. Al-Sultan
- Model and frameworks for mastering complex system (third edition), Kevin Forsberg, Hal Mooz , Howard Cottermc.
- Introduction to remote control systems and remote maintenance systems for system monitoring, Eike Wedekind
- National Grid SA TES-P-107.05 Cybersecurity requirements for SAS
- Security Operation Center (SOC) in Utility Organization (SEP 2014), Babu Veerapa Srinivas
Manuscripts should not have been published before
OMAINTEC Journal
(Journal of Scientific Review)
Publications Terms and Conditions
Languages:
The journal publishes research in English.
Referring:
All articles submitted for publications are subjected to peer referring.
Final acceptance is subject to authors making all appropriate modifications suggested by the referees. Sole responsibility for contents, however, rests with the authors, not the editors nor the journal.
1
Submitted manuscripts
should not be considered for publication elsewhere
2
Accepted Manuscripts may not be published elsewhere without written permission from the Editor – in – Chief
3
Authors must agree to transfer copyright to the publication. If the Journal wishes to reprint
the article, prior permission must be obtained from the authors
4
Permission to use previously published materials must be obtained by the authors
6
5
Authors must disclose sources of funding
A soft copy of the offprints will be sent to the author
8
7
Manuscripts received by the Journal cannot be returned whether published or not
OMAINTEC Journal
(Journal of Scientific Review)
Manuscript Requirement:
- Manuscripts must have the following sections: a one – page abstract in Arabic and English (about 150 words each); keywords; an introduction; a main body divided into the appropriate sections and sub-sections ; a conclusion, brief biographies of authors and a list of reference.
- Author’s full names and current affiliation must be given immediately below the title of the article.
- Manuscripts should be typed, double spaced in Simplified Arabic, 14 points font for the main text, and 12 point font for the end note. Only one side of the sheet should be used, and all copies must be meticulously proofread.
- Figures, graphs, and illustrations should be included in the text and should be in black and white. They should also be consecutively numbered and given title beneath them.
- Tables should be included within the text and consecutively numbered and given title beneath them.
- Margins should be 2.5 cm in width on all sides of the page.
- Footnotes should appear at the bottom of the page of the article followed by a list of references given in alphabetical order according authors family name.
Required Submissions:
Authors are required to submit the follo wing:
- Three copies of the manuscript prepared according to the Manuscripts preparation guideline.
- An electronic copy of the Manuscript on Microsoft Word for Windows.
- The Authors’ CV, including his/her full name in Arabic and English, current address, rank, and the most important publications.
- A submittal cover letter

OMAINTEC
JOURNAL
(Journal of Scientific Review)
ISSN 3005-6195
1


![]()
![]()
![]()
![]()
![]()
![]()
![]()
Arab Council of Operations & Maintenance
ISSU# 01 – April 2020
OMAINTEC.org